Neon Simple Trend Sniper
ลิงก์ TradingView
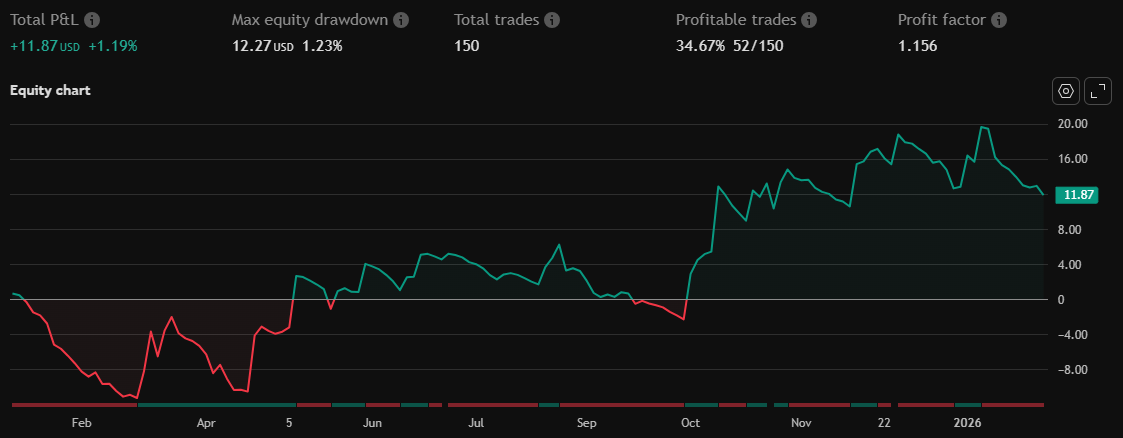
คำอธิบาย
she a nice buys rt on time sells rt on time works off of RSI
รูป Preview
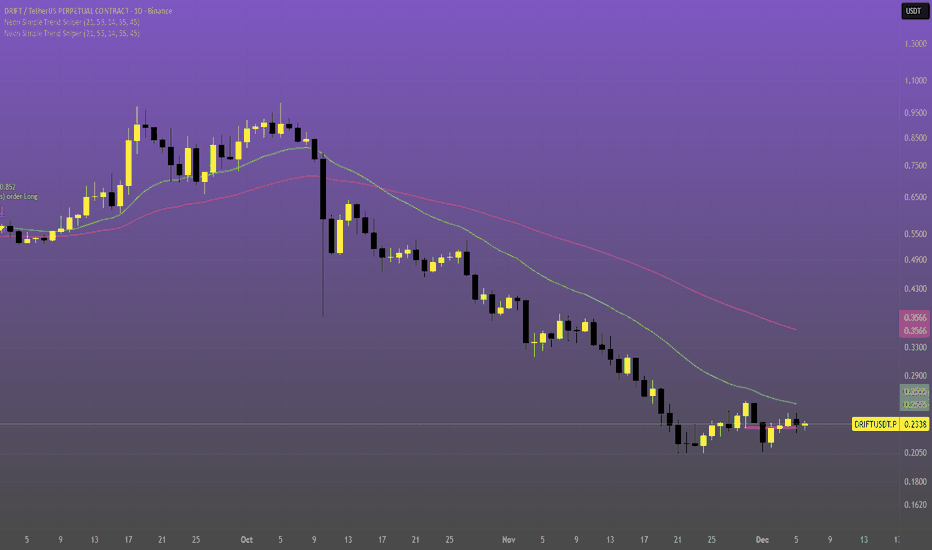
Pine Script Source
//@version=5
strategy("Neon Simple Trend Sniper",
     overlay = true,
     initial_capital = 10000,
     pyramiding = 10,
     default_qty_type  = strategy.percent_of_equity,
     default_qty_value = 10)

//––––– INPUTS
lenFast  = input.int(21,  "Fast EMA")
lenSlow  = input.int(55,  "Slow EMA")
rsiLen   = input.int(14,  "RSI Length")
rsiBuy   = input.int(55,  "RSI Buy Level",  minval = 1, maxval = 99)
rsiSell  = input.int(45,  "RSI Sell Level", minval = 1, maxval = 99)

//––––– CALCULATIONS
fastEMA  = ta.ema(close, lenFast)
slowEMA  = ta.ema(close, lenSlow)
rsiVal   = ta.rsi(close, rsiLen)

// Trend direction
bull = fastEMA > slowEMA
bear = fastEMA < slowEMA

//––––– ENTRY CONDITIONS
// More buys as price keeps moving in trend (pyramiding enabled)
longCond  = bull and ta.crossover(close, fastEMA)  and rsiVal > rsiBuy
shortCond = bear and ta.crossunder(close, fastEMA) and rsiVal < rsiSell

//––––– EXIT CONDITIONS
exitLong  = ta.crossunder(close, fastEMA)  or rsiVal < rsiSell
exitShort = ta.crossover(close, fastEMA)   or rsiVal > rsiBuy

//––––– ORDERS
if longCond
    strategy.entry("Long", strategy.long)

if shortCond
    strategy.entry("Short", strategy.short)

if exitLong
    strategy.close("Long")

if exitShort
    strategy.close("Short")

//––––– VISUALS
plot(fastEMA, title = "Fast EMA", color = color.new(color.green, 0), linewidth = 2)
plot(slowEMA, title = "Slow EMA", color = color.new(color.red,   0))