Estrategia Trend Following: 52w/26w Breakout
ลิงก์ TradingView
คำอธิบาย
This is a classic long-term Trend Following strategy, heavily inspired by the Donchian Channel system and the legendary "Turtle Trading" rules. It is designed to capture major market moves (bull runs) while filtering out short-term market noise and volatility.
This script is ideal for investors and swing traders who prefer a "hands-off" approach, looking to catch large trends rather than day-trading small fluctuations.
How it Works:
1. Entry Condition (The Breakout):
52-Week High: The strategy enters a Long position when the price breaks above the highest high of the last 252 trading days (approx. 1 year).
SuperTrend Filter: An additional filter using the SuperTrend indicator ensures that the breakout is supported by positive momentum, helping to reduce false signals during choppy lateral markets.
2. Exit Condition (The Trailing Stop):
26-Week Low: The strategy ignores short-term corrections. It only closes the position if the price closes below the lowest low of the last 126 trading days (approx. 6 months).
This wide stop allows the trade to "breathe" and stay open during significant pullbacks, ensuring you stay in the trend for as long as possible.
Features & Settings:
Customizable Lookback Periods: You can adjust the Entry (default 252 days) and Exit (default 126 days) periods in the settings menu.
Visual Aids:
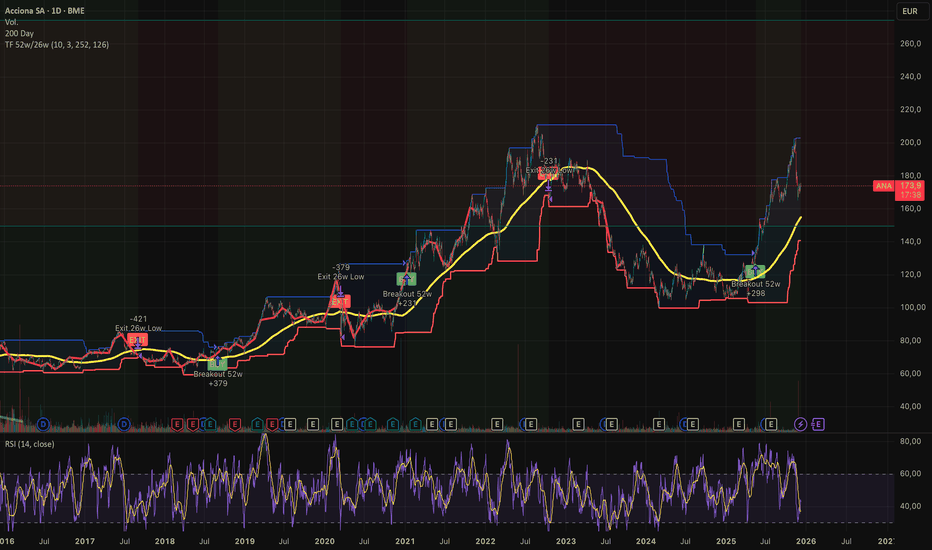
Blue Line: Represents the 1-Year High (Entry Threshold).
Red Line: Represents the 6-Month Low (Dynamic Stop Loss).
Channel Shading: Visualizes the trading range between the high and low.
Labels: Clearly marks "BUY" and "EXIT" points on the chart.
Recommended Usage:
Timeframe: Daily (1D). This logic is designed for daily candles.
Assets: Works best on assets with strong trending characteristics (e.g., Bitcoin/Crypto, Tech Stocks, Indices like SPX/NDX, and Commodities).
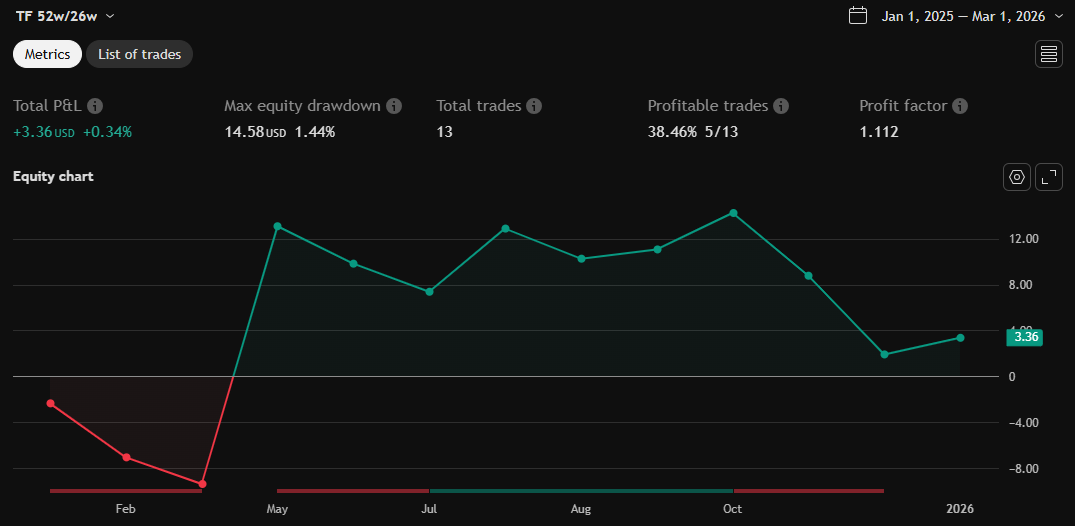
Patience Required: This strategy generates very few signals. It may stay quiet for months and then hold a position for over a year.
รูป Preview
Pine Script Source
// This source code is subject to the terms of the Mozilla Public License 2.0 at https://mozilla.org/MPL/2.0/
// © TuUsuario

//@version=5
strategy("Estrategia Trend Following: 52w/26w Breakout", shorttitle="TF 52w/26w", overlay=true, initial_capital=10000, default_qty_type=strategy.percent_of_equity, default_qty_value=100, currency=currency.USD)

// --- 1. CONFIGURACIÓN ---
group_entrada = "Configuración de Entrada"
group_salida = "Configuración de Salida"

// SuperTrend (Filtro)
atrPeriod = input.int(10, "Periodo ATR", group=group_entrada, tooltip="Periodo para calcular la volatilidad del SuperTrend.")
factor = input.float(3.0, "Factor SuperTrend", group=group_entrada, tooltip="Multiplicador del ATR. Un valor más alto hace el filtro menos sensible.")

// Donchian High (Entrada) - 252 días hábiles = 1 año trading
diasEntrada = input.int(252, "Longitud Breakout (Días)", group=group_entrada, tooltip="Número de velas atrás para buscar el máximo histórico (normalmente 252 para 1 año).")

// Donchian Low (Salida) - 126 días hábiles = 6 meses trading
diasSalida = input.int(126, "Trailing Stop (Días)", group=group_salida, tooltip="Número de velas atrás para buscar el mínimo donde saldremos (normalmente 126 para 6 meses).")

// --- 2. CÁLCULOS ---
// SuperTrend
[supertrend, direction] = ta.supertrend(factor, atrPeriod)

// Canales Donchian (High y Low)
// Usamos el offset [1] para mirar los máximos/mínimos hasta la vela anterior, no la actual.
techoAnual = ta.highest(high, diasEntrada)[1]
sueloSemestral = ta.lowest(low, diasSalida)[1]

// --- 3. LÓGICA DE TRADING ---

// CONDICIÓN DE ENTRADA (Largo):
// 1. SuperTrend es alcista (direction < 0)
// 2. El precio cruza o iguala el máximo de los últimos 252 días
longCondition = (direction < 0) and (close >= techoAnual) and strategy.position_size == 0

// CONDICIÓN DE SALIDA:
// El precio cierra por debajo del mínimo de los últimos 126 días
exitCondition = close < sueloSemestral and strategy.position_size > 0

// --- 4. EJECUCIÓN DE ÓRDENES ---

if (longCondition)
    strategy.entry("Long", strategy.long, comment="Breakout 52w")

if (exitCondition)
    strategy.close("Long", comment="Exit 26w Low")

// --- 5. VISUALIZACIÓN ---

// Colores dinámicos
colorTecho = color.new(color.blue, 0)
colorSuelo = color.new(color.red, 0)

// Plotear las líneas
p1 = plot(techoAnual, title="Techo (Entrada)", color=colorTecho, linewidth=1, style=plot.style_line)
p2 = plot(sueloSemestral, title="Suelo (Salida)", color=colorSuelo, linewidth=2, style=plot.style_line)

// Rellenar el canal para ver el rango operativo
fill(p1, p2, color=color.new(color.blue, 95), title="Rango del Canal")

// Señales visuales en el gráfico (Triángulos)
plotshape(longCondition, title="Señal Compra", style=shape.labelup, location=location.belowbar, color=color.green, text="BUY", textcolor=color.white, size=size.tiny)
plotshape(exitCondition, title="Señal Venta", style=shape.labeldown, location=location.abovebar, color=color.red, text="EXIT", textcolor=color.white, size=size.tiny)

// Colorear fondo si estamos dentro del mercado
bgcolor(strategy.position_size > 0 ? color.new(color.green, 95) : na, title="Posición Activa")