G-BOT ENGULFING CANDLE - FIXED SL & TP
ลิงก์ TradingView

คำอธิบาย
// Description:
This Pine Script strategy identifies bullish and bearish engulfing candle patterns over a defined lookback period and places trades based
on recent market highs and lows. It calculates stop loss and take profit levels using the Average True Range (ATR) multiplied by a user-defined factor, with the ability to adjust the risk-to-reward ratio for each trade.
รูป Preview
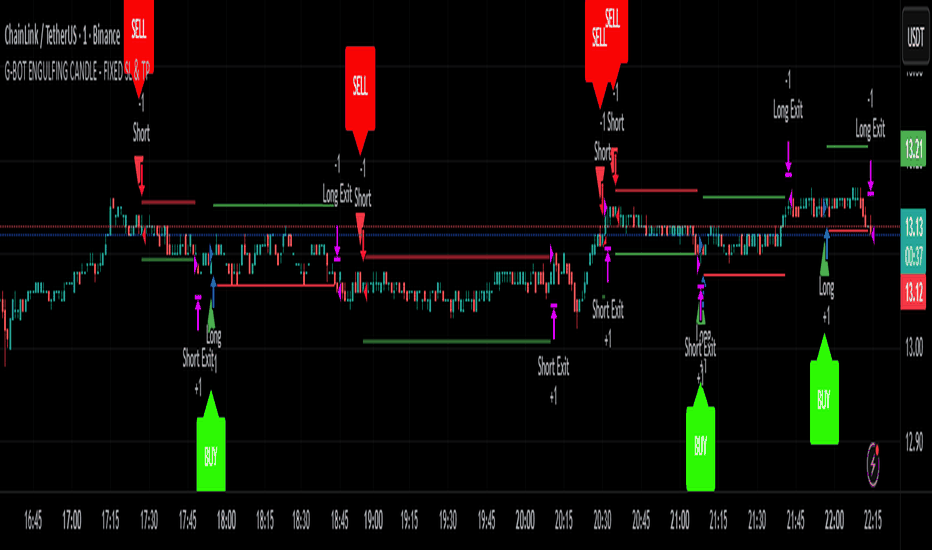
Pine Script Source
//       Name:

// “BEC - Engulfing ATR Fixed SL/TP Strategy”
// (BEC = Bullish/Bearish Engulfing Candle)

// Description:

// This Pine Script strategy identifies bullish and bearish engulfing candle patterns over a defined lookback period and places trades based
// on recent market highs and lows. It calculates stop loss and take profit levels using the Average True Range (ATR) multiplied by a user-defined factor,
// with the ability to adjust the risk-to-reward ratio for each trade.

// Key Features:

// Engulfing Candle Detection
// Bullish Engulfing: Current candle closes higher than the previous candle’s open while the previous candle was bearish.
// Bearish Engulfing: Current candle closes lower than the previous candle’s open while the previous candle was bullish.
// Lookback Confirmation
// Trades are only triggered if the current low (for long) or high (for short) matches the highest high or lowest low over a configurable lookback period.
// ATR-Based Stop Loss & Take Profit
// Stop loss is calculated as a multiple of ATR below (for long) or above (for short) recent lows/highs.
// Take profit is calculated using a user-defined risk-to-reward ratio.
// Trade Execution & Alerts
// Opens long positions when bullish conditions are met.
// Opens short positions when bearish conditions are met.
// Sends alerts when buy or sell signals are triggered.
// Visual Guidance
// Displays buy/sell triangles on the chart.
// Plots active stop loss and take profit lines for easy monitoring.
//----------------------------------//
//----------------------------------//
//----------------------------------//
//----------------------------------//
//--------------------------------------------------------------------------------------------------------------------//
// This source code is subject to the terms of the Mozilla Public License 2.0 at https://mozilla.org/MPL/2.0/

// @version=6
strategy("G-BOT ENGULFING CANDLE - FIXED SL & TP ", overlay=true)  // STRATEGY - NAME OF STRATEGY - OVERLAY OR NOT ( RUN OVER CHAT OR SPILT SCREEN)

lookback    = input.int(title="Lookback", defval=7, tooltip = "THIS LOOKBACK IS TO LOOK BACK OVER THE PREVIOUS BARS (CANDLES)", group = "GBOT SETTING")// THIS LOOKBACK IS TO LOOK BACK OVER THE PREVIOUS BARS (CANDLES)
multiplier  = input.float(title="ATR Multiplier", defval=1.0, tooltip = "THIS MULTIPLIER IS FOR ATR MULTIPLIER FOR STOP LOSS & TAKE PROFIT ", group = "GBOT SETTING")// THIS MULTIPLIER IS FOR ATR MULTIPLIER FOR STOP LOSS & TAKE PROFIT
rr          = input.float(title="Risk:Reward", defval=1.5, tooltip = "THIS RR IS FOR RISK TO REWARD", group = "GBOT SETTING") // THIS RR IS FOR RISK TO REWARD

float atr = ta.atr(14)
bool sharedFilters = not na(atr) and strategy.position_size == 0 and barstate.isconfirmed

bool bullEC = close[1] < open[1] and open <= close[1] and close >= open[1]
bool bearEC = close[1] > open[1] and open >= close[1] and close <= open[1]

float recentHigh = ta.highest(high, lookback)
float recentLow = ta.lowest(low, lookback)

bool buySignal  = bullEC and low == recentLow and sharedFilters
bool sellSignal = bearEC and high == recentHigh and sharedFilters

float longStop  = recentLow - (atr * multiplier)
float shortStop = recentHigh + (atr * multiplier)
float longStopDistance  = close - longStop
float shortStopDistance = shortStop - close
float longTarget  = close + (longStopDistance * rr)
float shortTarget = close - (shortStopDistance * rr)

var float t_stop = 0.0
var float t_target = 0.0

if (buySignal)
    strategy.entry(id="Long", direction=strategy.long)
    t_stop := longStop
    t_target := longTarget

if buySignal
    alert("BUY SIGNAL HAS BEEN TRIGGERED:" + str.tostring(close), alert.freq_once_per_bar)

if (sellSignal)
    strategy.entry(id="Short", direction=strategy.short)
    t_stop := shortStop
    t_target := shortTarget

if sellSignal
    alert("SELL SIGNAL HAS BEEN TRIGGERED:" + str.tostring(close), alert.freq_once_per_bar)

strategy.exit(id="Long Exit", from_entry="Long", limit=t_target, stop=t_stop)
strategy.exit(id="Short Exit", from_entry="Short", limit=t_target, stop=t_stop)

plotshape(buySignal, style=shape.triangleup, color=color.green, size = size.small, location=location.belowbar)
plotshape(sellSignal, style=shape.triangledown, color=color.red, size = size.small, location=location.abovebar)
plot(strategy.position_size != 0 ? t_stop : na, color=color.red, style=plot.style_linebr)
plot(strategy.position_size != 0 ? t_target : na, color=color.green, style=plot.style_linebr)


plotshape(buySignal, style=shape.labelup, location=location.belowbar, color=color.new(#2df904, 0), size=size.large, text='BUY', textcolor=color.new(color.white, 0)) //plotting up arrow when buy/long conditions met
plotshape(sellSignal, style=shape.labeldown, location=location.abovebar, color=color.new(#f90404, 0), size=size.large, text='SELL', textcolor=color.new(color.white, 0)) //plotting down arrow when sell/short conditions met