RSI BREAKOUT SIGNALS
ลิงก์ TradingView

คำอธิบาย
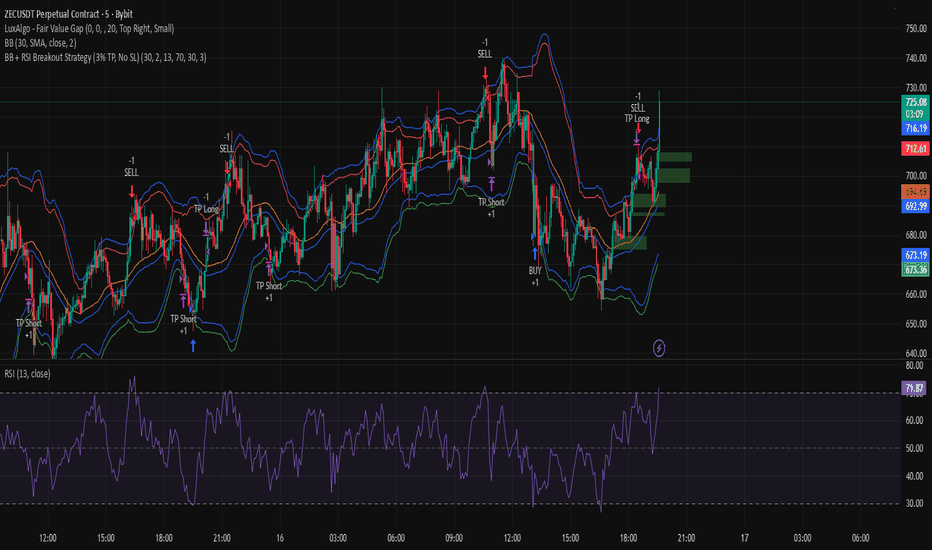
This BB + RSI Breakout indicator is designed to help traders identify potential buy and sell opportunities based on price movements relative to the Donchian channel (or Bollinger-type channel) and momentum conditions. It calculates the highest high and lowest low over a user-defined length to form a dynamic channel, and then it checks whether the current price breaks above the upper band (for a buy signal) or below the lower band (for a sell signal). To avoid repeated signals in a row, the indicator uses a state system: after a buy signal occurs, it will not generate another buy until a sell occurs, and vice versa. When a buy signal is triggered, it automatically calculates a take-profit price a certain percentage above the buy candle and displays this price below the candle as a “TP” label. Sell signals are displayed above the candle, and any previous TP label is cleared. The indicator updates in real time, so the signals move with the chart, giving a clear and lag-free visualization of entry points and potential profit targets.
รูป Preview
Pine Script Source
//@version=5
strategy("BB + RSI Breakout Strategy (3% TP, No SL)", overlay=true, initial_capital=1000)

// ————— Inputs —————
bbLength = input.int(30, "BB Length")
bbMult   = input.float(2.0, "BB Multiplier")
rsiLen   = input.int(13, "RSI Length")
rsiOB    = input.int(70, "RSI Overbought Level")
rsiOS    = input.int(30, "RSI Oversold Level")

takeProfitPercent = input.float(3.0, "Take Profit %")

// ————— Bollinger Bands —————
basis = ta.sma(close, bbLength)
dev = bbMult * ta.stdev(close, bbLength)
upper = basis + dev
lower = basis - dev

plot(basis, "BB Basis", color=color.blue)
plot(upper, "BB Upper", color=color.red)
plot(lower, "BB Lower", color=color.green)

// ————— RSI —————
rsi = ta.rsi(close, rsiLen)

// ————— Buy & Sell Conditions —————
buySignal  = close < lower and rsi < rsiOS
sellSignal = close > upper and rsi > rsiOB

// ————— Entries —————
if (buySignal)
    strategy.entry("BUY", strategy.long)

if (sellSignal)
    strategy.entry("SELL", strategy.short)

// ————— 3% Take Profit (NO STOP LOSS) —————
tpLong  = strategy.position_avg_price * (1 + takeProfitPercent / 100)
tpShort = strategy.position_avg_price * (1 - takeProfitPercent / 100)

strategy.exit("TP Long",  from_entry="BUY",  limit=tpLong)
strategy.exit("TP Short", from_entry="SELL", limit=tpShort)