Stochastic + Bollinger Bands Multi-Timeframe Strategy
ลิงก์ TradingView
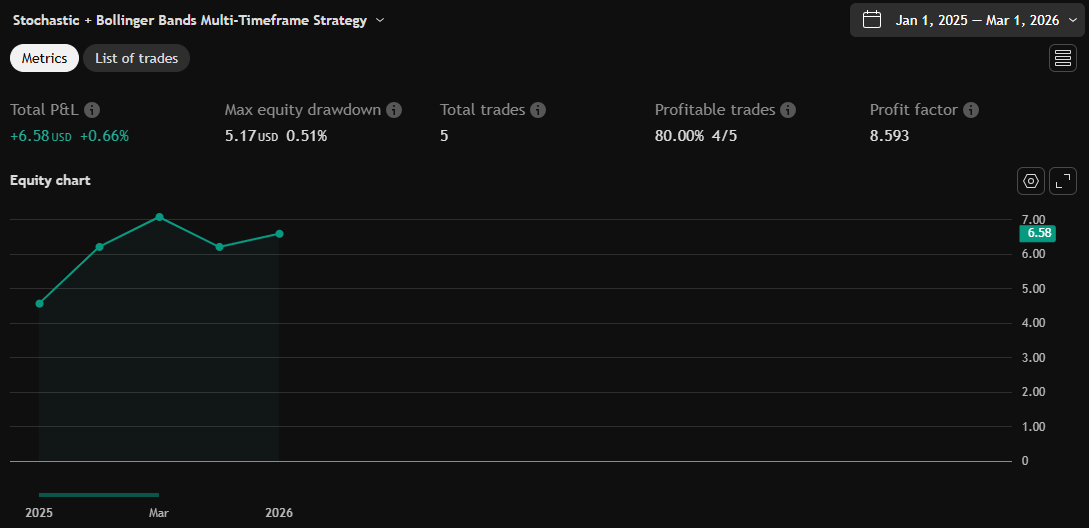
คำอธิบาย
This strategy fuses the Stochastic Oscillator from the 4-hour timeframe with Bollinger Bands from the 1-hour timeframe, operating on a 10-hour chart to capture a unique volatility rhythm and temporal alignment discovered through observational alpha.
By blending momentum confirmation from the higher timeframe with short-term volatility extremes, the strategy leverages what some traders refer to as “rotating volatility” — a phenomenon where multi-timeframe oscillations sync to reveal hidden trade opportunities.
🧠 Strategy Logic
✅ Long Entry Condition:
Stochastic on the 4H timeframe:
%K crosses above %D
Both %K and %D are below 20 (oversold zone)
Bollinger Bands on the 1H timeframe:
Price crosses above the lower Bollinger Band, indicating a potential reversal
→ A long trade is opened when both momentum recovery and volatility reversion align.
✅ Long Exit Condition:
Stochastic on the 4H:
%K crosses below %D
Both %K and %D are above 80 (overbought zone)
Bollinger Bands on the 1H:
Price reaches or exceeds the upper Bollinger Band, suggesting exhaustion
→ The long trade is closed when either signal suggests a potential reversal or overextension.
🧬 Temporal Structure & Alpha
This strategy is deployed on a 10-hour chart — a non-standard timeframe that may align more effectively with multi-timeframe mean reversion dynamics.
This subtle adjustment exploits what some traders identify as “temporal drift” — the desynchronization of volatility across timeframes that creates hidden rhythm in price action.
→ For example, Stochastic on 4H (lookback 17) and Bollinger Bands on 1H (lookback 20) may periodically sync around 10H intervals, offering unique alpha windows.
📊 Indicator Components
🔹 Stochastic Oscillator (4H, Length 17)
Detects momentum reversals using %K and %D crossovers
Helps define overbought/oversold zones from a mid-term view
🔹 Bollinger Bands (1H, Length 20, ±2 StdDev)
Measures price volatility using standard deviation around a moving average
Entry occurs near lower band (support), exits near upper band (resistance)
🔹 Multi-Timeframe Logic
Uses request.security() to safely reference 4H and 1H indicators from a 10H chart
Avoids repainting by using closed higher-timeframe candles only
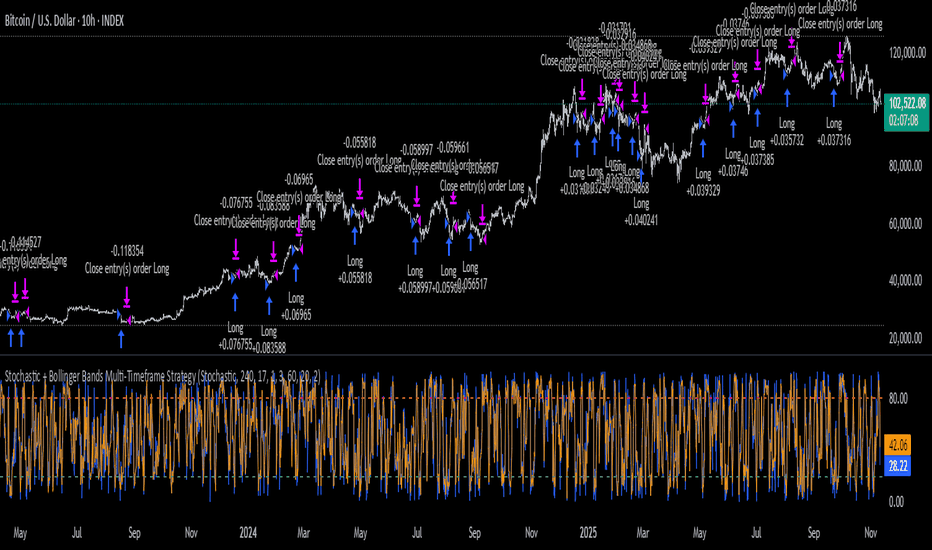
📈 Visualization
A plot selector input allows toggling between:
Stochastic Plot (%K & %D, with overbought/oversold levels)
Bollinger Bands Plot (Upper, Basis, Lower from 1H data)
This helps users visually confirm entry/exit triggers in real time.
🛠 Customization
Fully configurable Stochastic and BB settings
Timeframes are independently adjustable
Strategy settings like position sizing, slippage, and commission are editable
⚠️ Disclaimer
This strategy is intended for educational and informational purposes only.
It does not constitute financial advice or a recommendation to buy or sell any asset.
Market conditions vary, and past performance does not guarantee future results.
Always test any trading strategy in a simulated environment and consult a licensed financial advisor before making real-world investment decisions.
รูป Preview
Pine Script Source
// This Pine Script® code is subject to the terms of the Mozilla Public License 2.0 at https://mozilla.org/MPL/2.0/
// © RWCS_LTD

//@version=6
strategy("Stochastic + Bollinger Bands Multi-Timeframe Strategy",
     overlay = false,
     pyramiding = 0,
     initial_capital = 1000,
     default_qty_type = strategy.percent_of_equity,
     default_qty_value = 100,
     slippage = 3,
     commission_value = 0.045
     )

// === INPUTS ===
group1 = "Plotting Options"
group2 = "Stochastic Settings"
group3 = "Bollinger Bands Settings"

plotChoice = input.string("Stochastic", title="Plot Selector", options=["Stochastic", "Bollinger Bands"], group = group1)

STOCH_TIME = input.timeframe("240", "Stochastic Timeframe", group = group2)
stochKLen = input.int(17, title="%K Length", group = group2)
stochSmoothK = input.int(1, title="%K Smoothing", group = group2)
stochDLen = input.int(3, title="%D Smoothing", group = group2)

BB_TIME = input.timeframe("60", "Bollinger Bands Timeframe", group = group3)
bbLen = input.int(20, title="BB Length", group = group3)
bbMult = input.float(2.0, title="BB Multiplier", group = group3)


// === STOCHASTIC on 1D ===
[k, d] = request.security(syminfo.tickerid, STOCH_TIME,
     [ta.sma(ta.stoch(close, high, low, stochKLen), stochSmoothK),
     ta.sma(ta.sma(ta.stoch(close, high, low, stochKLen), stochSmoothK), stochDLen)]
     )

stochLong = ta.crossover(k, d) and k < 20 and d < 20
stochExit = ta.crossunder(k, d) and k > 80 and d > 80

// === BOLLINGER BANDS on 4H ===
[bbBasis, bbUpper, bbLower] = request.security(syminfo.tickerid, BB_TIME,
     ta.bb(close, bbLen, bbMult)
     )

bbLong = ta.crossover(close, bbLower)
bbExit = close >= bbUpper

// === ENTRY & EXIT CONDITIONS ===
longCondition = stochLong and bbLong
if longCondition
    strategy.entry("Long", strategy.long)

exitCondition = stochExit or bbExit
if exitCondition
    strategy.close("Long")

// === PLOTTING ===
showStoch = plotChoice == "Stochastic"
showBB = plotChoice == "Bollinger Bands"

// Stochastic %K and %D
plot(showStoch ? k : na, title="%K (1D)", color=color.blue)
plot(showStoch ? d : na, title="%D (1D)", color=color.orange)
hline(showStoch ? 80 : na, "Stoch OB", color=color.red)
hline(showStoch ? 20 : na, "Stoch OS", color=color.green)

// Bollinger Bands
plot(showBB ? bbUpper : na, title="BB Upper (4H)", color=color.red)
plot(showBB ? bbBasis : na, title="BB Basis (4H)", color=color.gray)
plot(showBB ? bbLower : na, title="BB Lower (4H)", color=color.green)