W%R Pullback+EMA Trend [TS_Indie]
ลิงก์ TradingView
คำอธิบาย
🔰 Core Concept of the Strategy
The main idea is “Trend-Following with Momentum Pullback.”
This means trading in the direction of the main trend (defined by EMA) while using Williams %R to identify pullback entries (buying the dip or selling the rally) where momentum returns to the trend direction.
📊 Indicators Used
1. EMA Fast – Defines the short-term trend.
2. EMA Slow – Defines the long-term trend (used as a trend filter).
3. Williams %R
• Overbought zone: above -20
• Oversold zone: below -80
⚙️ Entry Rules
🔹 Buy Setup
1. EMA Fast > EMA Slow → Uptrend condition.
2. Williams %R on the previous candle dropped below -80, and on the current candle, it crosses back above -80 → indicates momentum returning to the upside.
3. Current close is above EMA Fast.
4. Entry Buy at the close of the candle where %R crosses above -80.
🎯 Entry, Stop Loss, and Take Profit
1. Entry : At the candle close where the signal occurs.
2. Stop Loss : At the lowest low between the current and previous candles.
3. Take Profit : Calculated based on entry price and stop loss distance multiplied by the Risk/Reward Ratio.
🔹 Sell Setup
1. EMA Fast < EMA Slow → Downtrend condition.
2. Williams %R on the previous candle went above -20, and on the current candle, it crosses back below -20 → indicates renewed selling momentum.
3. Current price is below EMA Fast.
4. Entry Sell at the close of the candle where %R crosses below -20.
🎯 Entry, Stop Loss, and Take Profit
1. Entry : At the candle close where the signal occurs.
2. Stop Loss : At the highest high between the current and previous candles.
3. Take Profit : Calculated based on entry price and stop loss distance multiplied by the Risk/Reward Ratio.
⚙️ Optional Parameters
• Custom Risk/Reward Ratio for Take Profit.
• Option to add ATR buffer to Stop Loss.
• Adjustable EMA Fast period.
• Adjustable EMA Slow period.
• Adjustable Williams %R period.
• Option to enable Long only / Short only positions.
• Customizable Backtest start and end date.
• Customizable trading session time.
⏰ Alert Function
Alerts display:
• Entry price
• Stop Loss price
• Take Profit price
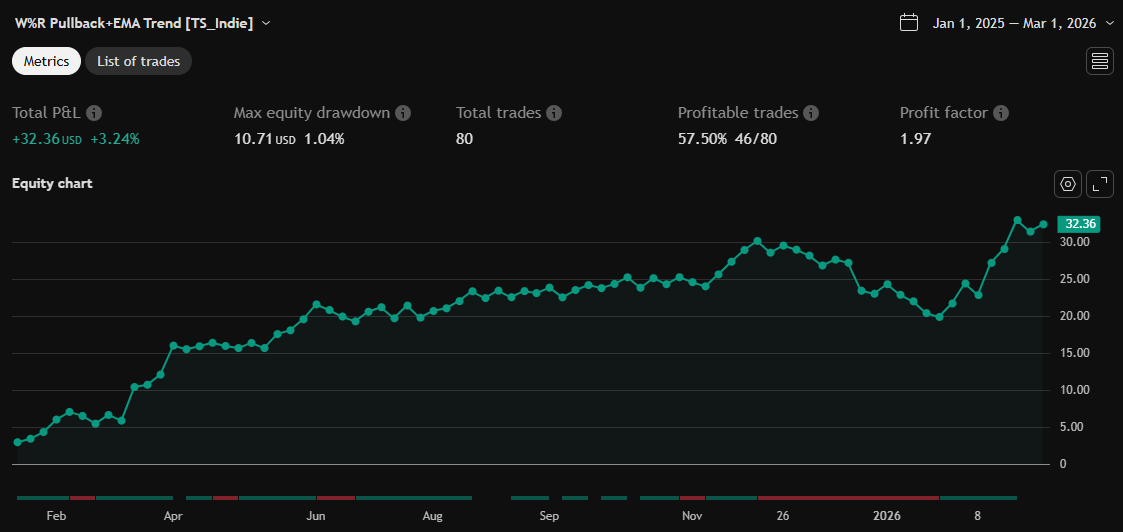
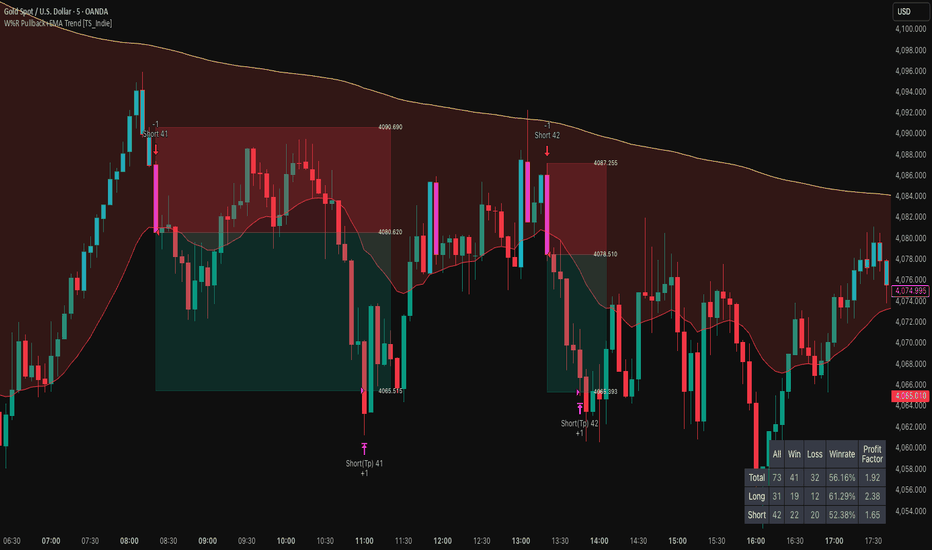
Guys, try adjusting the parameters yourselves!
I’ve been tweaking the settings for several days and managed to get great results on XAU/USD in the 5-minute timeframe.
I think this strategy is quite interesting and could potentially deliver good results on other instruments as well.
⚠️ Disclaimer
This indicator is designed for educational and research purposes only.
It does not guarantee profits and should not be considered financial advice.
Trading in financial markets involves significant risk, including the potential loss of capital.
รูป Preview
Pine Script Source
// This Pine Script® code is subject to the terms of the Mozilla Public License 2.0 at https://mozilla.org/MPL/2.0/
// © Truth_Strategy_Indie

//@version=6
strategy("W%R Pullback+EMA Trend [TS_Indie]", overlay=true, max_labels_count=500 , max_lines_count = 500 ,max_boxes_count = 500, max_bars_back = 5000 , margin_long=0, margin_short=0 ,  initial_capital=10000 , process_orders_on_close = true )

GROUP_1 = "====== Conditions Entry ======"
GROUP_2 = "====== Setup Risk/Reward Ratio ======"
GROUP_3 = "====== Setup Stop loss ATR ======"

// === Input Parameters ===
rr_ratio = input.float(1.5, "Risk/Reward Ratio", step=0.1 , inline="1" , group = GROUP_2 )
length_atr = input.int(title="Length ATR", defval=14, minval=1 , inline="2" , group = GROUP_3 )
x_ATR = input.float( 0 , "x ATR", step=0.1 , inline="2" , group = GROUP_3 )

maTypeInput_fast = input.string("EMA", "Type MA Fast", options = ["EMA", "SMA", "SMMA (RMA)", "WMA", "VWMA"], group = GROUP_1 , inline="3" , display = display.data_window)
ema_fast_len = input.int(15, "Length Fast" , inline="3.5" , group = GROUP_1 )
src_1 = input(close, "Source" , inline="3.5" , group = GROUP_1 )

maTypeInput_slow = input.string("EMA", "Type MA Slow", options = ["EMA", "SMA", "SMMA (RMA)", "WMA", "VWMA"], group = GROUP_1 , inline="4", display = display.data_window)
ema_slow_len = input.int(250, "Length Slow", inline="4.5" , group = GROUP_1 )
src_2 = input(close, "Source" , inline="4.5" , group = GROUP_1 )

wr_len = input.int(24, "Williams %R Length", inline="5"  , group = GROUP_1 )
Overbought = input.int(-20, "Ov_Bought", inline="6" , group = GROUP_1 )
Oversold = input.int(-80, "Ov_Sold", inline="6" , group = GROUP_1 )
long_t = input(true,"Entry Longㅤㅤ", inline="10" , group = GROUP_1 )
short_t = input(true, "Entry Short" , inline="10" , group = GROUP_1 )

//====== Time Filter ======
Time_Filter = "====== Time Filter ======"
s_date = input.time(timestamp("01 Jan 1970"),"Start" , inline="1" , group = Time_Filter )
en_date = input.time(timestamp("01 Jan 2500"), "End " , inline="2" , group = Time_Filter )

con_date = time >= s_date and time <= en_date
//======== session ========
_session(sess) =>
    not na(time(timeframe.period, sess, "UTC+0" ))

s_New_York = input.bool( false ,"New York" , inline = "3" , group = Time_Filter )
t_New = input.session( '1300-2200', "" , inline = "3" , group = Time_Filter )
Session_1 = _session(t_New) , cf_ses1 = s_New_York ? Session_1 : false

s_London = input.bool( false ,"London" , inline = "4" , group = Time_Filter )
t_Lon = input.session( '0700-1600' , "" , inline = "4" , group = Time_Filter )
Session_2 = _session(t_Lon) , cf_ses2 = s_London ? Session_2 : false

s_Tokyo = input.bool( false ,"Tokyo" , inline = "5" , group = Time_Filter )
t_Tokyo = input.session( '0000-0900' , "" , inline = "5" , group = Time_Filter )
Session_3 = _session(t_Tokyo) , cf_ses3 = s_Tokyo ? Session_3 : false

s_Sydney = input.bool( false ,"Sydney" , inline = "6" , group = Time_Filter )
t_Syd = input.session( '2100-0600' , "" , inline = "6" , group = Time_Filter )
Session_4 = _session(t_Syd) , cf_ses4 = s_Sydney ? Session_4 : false

ses_check = s_New_York or s_London or s_Tokyo or s_Sydney
time_con = cf_ses1 or cf_ses2 or cf_ses3 or cf_ses4
con_time = ses_check ? time_con : true

// MA Calculation
ma(source, length, MAtype) =>
	switch MAtype
		"SMA"                   => ta.sma(source, length)
		"EMA"                   => ta.ema(source, length)
		"SMMA (RMA)"            => ta.rma(source, length)
		"WMA"                   => ta.wma(source, length)
		"VWMA"                  => ta.vwma(source, length)


atr_sl = ta.ema(ta.tr(true), length_atr)

var int c_order_buy = 0 , var int c_order_sell = 0
bool pending_buy = false , bool pending_sell = false
var float stop_loss_long = 0 , var float stop_loss_short = 0
var float take_profit_long = 0 , var float take_profit_short = 0
// === Indicator Calculation ===
ema_fast = ma(src_1, ema_fast_len, maTypeInput_fast)
ema_slow = ma(src_2, ema_slow_len, maTypeInput_slow)

_pr(length) =>
    max = ta.highest(length)
    min = ta.lowest(length)
    100 * (close - max) / (max - min)
wr = _pr(wr_len)

// === Trend Filter ===
uptrend = ema_fast > ema_slow
downtrend = ema_fast < ema_slow

Wr_Overbought = math.abs(Overbought)*-1
Wr_Oversold = math.abs(Oversold)*-1

wr_crossover_up = ( wr[1]<Wr_Oversold and wr > Wr_Oversold ) and uptrend
wr_crossover_down = ( wr[1] > Wr_Overbought and wr < Wr_Overbought ) and downtrend

// === Entry Conditions ===
buy_signal = barstate.isconfirmed and long_t and close > ema_fast and wr_crossover_up  and strategy.position_size == 0 and con_time and con_date
sell_signal = barstate.isconfirmed and short_t and close < ema_fast and wr_crossover_down and strategy.position_size == 0 and con_time and con_date

// === Position Size ===
risk_pips = atr_sl * x_ATR

// === Long Entry ===
if (buy_signal) and barstate.isconfirmed
    sl_cal_long = low < low[1] ? low : low[1]
    stop_loss_long := sl_cal_long - risk_pips
    take_profit_long := close + (close - stop_loss_long)*rr_ratio
    c_order_buy += 1
    cs_buy = str.tostring(c_order_buy)
    strategy.entry("Long "+cs_buy, strategy.long)
    strategy.exit("Long Exit "+cs_buy , "Long "+cs_buy , stop = stop_loss_long , limit = take_profit_long , comment_profit = "Long(Tp) "+cs_buy ,comment_loss = "Long(SL) "+cs_buy )
    p_entry = "\n\nEntry price = "+str.tostring( close , format.mintick)
    p_sl = "\n\nStop loss = "+str.tostring(stop_loss_long, format.mintick)
    p_tp = "\n\nTarget profit = "+str.tostring(take_profit_long, format.mintick)
    alert("Long_"+p_entry+p_sl+p_tp, alert.freq_all)
    pending_buy := true

// === Short Entry ===
if (sell_signal) and barstate.isconfirmed
    sl_cal_short = high > high[1] ? high : high[1]
    stop_loss_short := sl_cal_short + risk_pips
    take_profit_short := close - (stop_loss_short - close)*rr_ratio
    c_order_sell += 1
    cs_sell = str.tostring(c_order_sell)
    strategy.entry("Short "+cs_sell, strategy.short)
    strategy.exit("Short Exit "+cs_sell ,"Short "+cs_sell , stop = stop_loss_short , limit = take_profit_short , comment_profit = "Short(Tp) "+cs_sell ,comment_loss = "Short(SL) "+cs_sell )
    p_entry = "\n\nEntry price = "+str.tostring( close , format.mintick)
    p_sl = "\n\nStop loss = "+str.tostring(stop_loss_short, format.mintick)
    p_tp = "\n\nTarget profit = "+str.tostring(take_profit_short, format.mintick)
    alert("Short_"+p_entry+p_sl+p_tp, alert.freq_all)
    pending_sell := true

//show pending
n_bar = 5
col_1 = #08998119  , col_2 = #f2364619
text_line2_col = color.rgb(0, 7, 220) , TRANSP = #ffffff00
//show Buy
if pending_buy
    box_entrybuy_1_his = box.new(xloc = xloc.bar_index ,left = bar_index , top = take_profit_long, right = bar_index+n_bar , bottom = close , border_color = col_1 ,bgcolor = col_1)
    box_entrybuy_2_his = box.new(xloc = xloc.bar_index ,left = bar_index , top = close, right = bar_index+n_bar , bottom = stop_loss_long , border_color = col_2 ,bgcolor = col_2)
    lbl_entry_his = label.new(bar_index+n_bar, close , str.tostring(close,format.mintick) ,xloc = xloc.bar_index, color = TRANSP, textcolor = text_line2_col, style = label.style_label_center, size = size.tiny)
    lbl_tp_his = label.new(bar_index+n_bar, take_profit_long , str.tostring(take_profit_long,format.mintick),xloc = xloc.bar_index, color = TRANSP, textcolor = text_line2_col, style = label.style_label_center, size = size.tiny)
    lbl_sl_his = label.new(bar_index+n_bar, stop_loss_long , str.tostring(stop_loss_long,format.mintick) ,xloc = xloc.bar_index, color = TRANSP, textcolor = text_line2_col, style = label.style_label_center, size = size.tiny)
//show sell
if  pending_sell
    box_entrysell_1_his = box.new(xloc = xloc.bar_index,left = bar_index , top = take_profit_short, right = bar_index+n_bar , bottom = close , border_color = col_1 ,bgcolor = col_1)
    box_entrysell_2_his = box.new(xloc = xloc.bar_index,left = bar_index , top = close, right = bar_index+n_bar , bottom = stop_loss_short , border_color = col_2 ,bgcolor = col_2)
    lbl_entry_his = label.new(bar_index+n_bar, close , str.tostring(close,format.mintick) ,xloc = xloc.bar_index, color = TRANSP, textcolor = text_line2_col, style = label.style_label_center, size = size.tiny)
    lbl_tp_his = label.new(bar_index+n_bar, take_profit_short , str.tostring(take_profit_short,format.mintick),xloc = xloc.bar_index, color = TRANSP, textcolor = text_line2_col, style = label.style_label_center, size = size.tiny)
    lbl_sl_his = label.new(bar_index+n_bar, stop_loss_short , str.tostring(stop_loss_short,format.mintick) ,xloc = xloc.bar_index, color = TRANSP, textcolor = text_line2_col, style = label.style_label_center, size = size.tiny)

// === Plotting ===
p1 = plot(ema_fast, color= #f23645, title="EMA fast")
p2 = plot(ema_slow, color=#00332a, title="EMA slow")

fill(p1, p2, color = ema_fast > ema_slow ? color.rgb(67, 160, 71, 95) : color.rgb(244, 67, 54, 95))
plot(wr,"Williams %R" ,color = color.new(color.blue, 0), display = display.status_line , precision = 2  )

con_Overbought = wr > math.abs(Overbought)*-1 and downtrend
con_Oversold = wr < math.abs(Oversold)*-1 and uptrend

barcolor( con_Oversold ? color.blue : na ,title = "Bar Oversold")
barcolor( wr_crossover_up ? color.orange  : na ,title = "Bar Crossover Up")

barcolor( con_Overbought ? color.aqua : na ,title = "Bar Overbought")
barcolor( wr_crossover_down ? color.fuchsia : na ,title = "Bar Crossover Down")

bgcolor(s_New_York and cf_ses1 ? color.rgb(255, 251, 0, 92) : na ,title = "New York")
bgcolor(s_London and cf_ses2 ? color.rgb(255, 0, 255, 92) : na ,title = "London")
bgcolor(s_Tokyo and cf_ses3? color.rgb(111, 255, 82, 92) : na ,title = "Tokyo")
bgcolor(s_Sydney and cf_ses4? color.rgb(82, 122, 255, 92) : na ,title = "Sydney")

Location_session = ((9*60*60) / timeframe.in_seconds(timeframe.period)) / 2
Lbl_New_York = not cf_ses1 and cf_ses1 != cf_ses1[1] and s_New_York and t_New == '1300-2200' and timeframe.in_seconds(timeframe.period) <= 32400
plotshape( Lbl_New_York , "Session New York", shape.labeldown, location.bottom, na , offset = -Location_session  , text = "New York", textcolor = #fffb00, size = size.tiny, display = display.all - display.status_line, editable = false)
Lbl_London = not cf_ses2 and cf_ses2 != cf_ses2[1] and s_London and t_Lon == '0700-1600' and timeframe.in_seconds(timeframe.period) <= 32400
plotshape( Lbl_London , "Session London", shape.labeldown, location.bottom, na , offset = -Location_session  , text = "London", textcolor = #ff00ff , size = size.tiny, display = display.all - display.status_line, editable = false)
Lbl_Tokyo = not cf_ses3 and cf_ses3 != cf_ses3[1] and s_Tokyo and t_Tokyo == '0000-0900' and timeframe.in_seconds(timeframe.period) <= 32400
plotshape( Lbl_Tokyo , "Session Tokyo", shape.labeldown, location.bottom, na , offset = -Location_session  , text = "Tokyo", textcolor = #6fff52 , size = size.tiny, display = display.all - display.status_line, editable = false)
Lbl_Sydney = not cf_ses4 and cf_ses4 != cf_ses4[1] and s_Sydney and t_Syd == '2100-0600' and timeframe.in_seconds(timeframe.period) <= 32400
plotshape( Lbl_Sydney , "Session Sydney", shape.labeldown, location.bottom, na , offset = -Location_session  , text = "Sydney", textcolor = #527aff , size = size.tiny, display = display.all - display.status_line, editable = false)