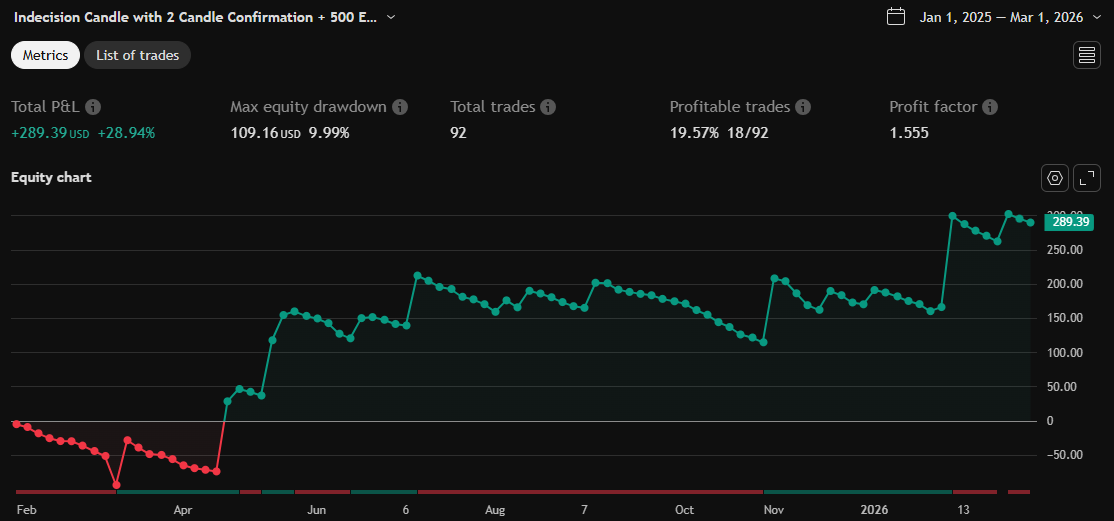
Indecision Candle with 2 Candle Confirmation + 500 EMA - parthib
ลิงก์ TradingView
คำอธิบาย
Indecision Candle with 2 Candle Confirmation + 500 EMA
Indecision Candle with 2 Candle Confirmation + 500 EMA
Indecision Candle with 2 Candle Confirmation + 500 EMAIndecision Candle with 2 Candle Confirmation + 500 EMAIndecision Candle with 2 Candle Confirmation + 500 EMA
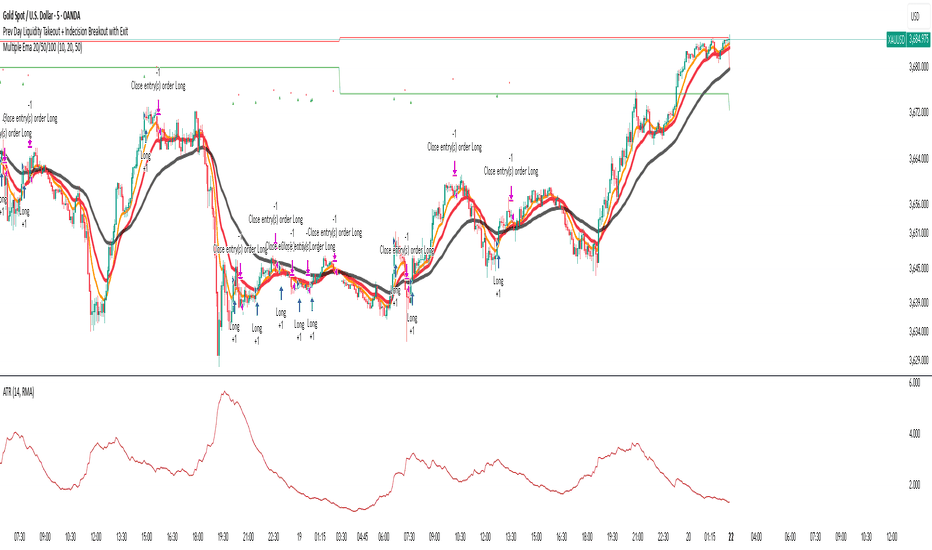
รูป Preview
Pine Script Source
//@version=5
strategy("Indecision Candle with 2 Candle Confirmation + 500 EMA", overlay=true)

ema_500 = ta.ema(close, 500)
plot(ema_500, color=color.orange, linewidth=1)

// 2 continuous down candles before indecision candle (bars [2], [1])
down_2 = (close[2] < open[2]) and (close[1] < open[1])

// 2 continuous up candles before indecision candle (bars [2], [1])
up_2 = (close[2] > open[2]) and (close[1] > open[1])

// Identify indecision candle (bar [0])
body = math.abs(close - open)
upper_wick = high - math.max(close, open)
lower_wick = math.min(close, open) - low
is_indecision = (body <= (high - low) * 0.25) and (upper_wick > body) and (lower_wick > body)

// Buy condition: 2 down candles + indecision + next candle closes above indecision high + price above 500 EMA
buy_condition = down_2[1] and is_indecision[1] and close > high[1] and close > ema_500

// Sell condition: 2 up candles + indecision + next candle closes below indecision low + price below 500 EMA
sell_condition = up_2[1] and is_indecision[1] and close < low[1] and close < ema_500

// Stop loss points
buy_stop = low[1]
sell_stop = high[1]

// Entry and exit
if buy_condition
    strategy.entry("Long", strategy.long)
    strategy.exit("Long Exit", "Long", stop=buy_stop)

if sell_condition
    strategy.entry("Short", strategy.short)
    strategy.exit("Short Exit", "Short", stop=sell_stop)

// Plot signals
plotshape(buy_condition, location=location.belowbar, color=color.green, style=shape.triangleup, title="Buy Signal")
plotshape(sell_condition, location=location.abovebar, color=color.red, style=shape.triangledown, title="Sell Signal")