Range Breakout Strategy
ลิงก์ TradingView
คำอธิบาย
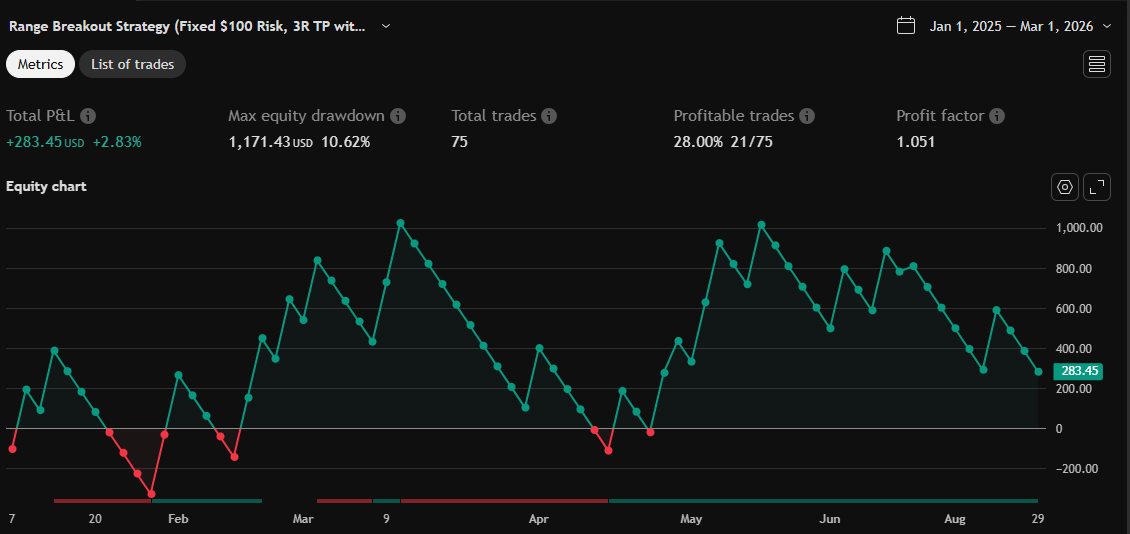
After consecutive candle closes it creates a range, and if price breaks out of it it enters with fixed take profit.
รูป Preview

Pine Script Source
//@version=6
strategy("Range Breakout Strategy (Fixed $100 Risk, 3R TP with R-Level Lines) [No Volume Filter + 1R BE SL + Time Exit]", overlay=true, initial_capital=10000, pyramiding=0, calc_on_every_tick=false, max_lines_count=500)

// === BACKTEST WINDOW ===
groupBT       = "Backtest Window"
useBT         = input.bool(true,  "Use Date Range", group=groupBT)
btStart       = input.time(timestamp("2025-01-01"), "Start", group=groupBT)
btEnd         = input.time(timestamp("2025-08-29"), "End",   group=groupBT)
forceFlatEnd  = input.bool(true, "Force flat at End", group=groupBT)

inBT          = not useBT or (time >= btStart and time <= btEnd)
justEnteredBT = useBT and (nz(time[1], 0) < btStart) and (time >= btStart)
justLeftBT    = useBT and (nz(time[1], 0) <= btEnd)  and (time > btEnd)

// === INPUTS ===
minConsecutive = input.int(3, "Min consecutive bars", minval=2)
maxConsecutive = input.int(5, "Max consecutive bars", minval=2)
riskReward     = input.float(3.0, "Risk/Reward (R)", step=0.25, minval=0.25)
riskAmount     = input.float(100.0, "USD risk per trade", step=1, minval=1)
maxBarsToWait  = input.int(10, "Invalidate range after N bars", minval=1)

// === STATE ===
var int   streakLen      = 0
var float rangeLow       = na
var float rangeHigh      = na
var bool  rangeActive    = false
var box   currentBox     = na
var int   barsSinceRange = na
var bool  hasBrokenOut   = false

// === TRAILING SL STATE ===
var float oneRPrice  = na
var bool movedToBE   = false

// === STREAK LOGIC ===
dirNow  = close > close[1] ? 1 : close < close[1] ? -1 : 0
dirPrev = close[1] > close[2] ? 1 : close[1] < close[2] ? -1 : 0
streakLen := na(close[2]) ? 1 : dirNow == 0 ? 1 : (dirNow == dirPrev ? streakLen + 1 : 1)

// === Reset state on BT entry ===
if justEnteredBT
    streakLen      := 1
    rangeActive    := false
    barsSinceRange := na
    hasBrokenOut   := false
    if not na(currentBox)
        box.delete(currentBox)
        currentBox := na

// === TRADING STATE ===
flat        = strategy.position_size == 0
noOpenTrade = strategy.opentrades == 0
canTrade    = flat and noOpenTrade and inBT

// === NEW RANGE DETECTION ===
isValidStreak = streakLen >= minConsecutive and streakLen <= maxConsecutive
isNewRange    = canTrade and isValidStreak

if isNewRange and barstate.isconfirmed
    if not na(currentBox)
        box.delete(currentBox)

    startBarIndex = bar_index - streakLen + 1
    startPrice    = open[streakLen - 1]
    endPrice      = close
    rLow          = math.min(startPrice, endPrice)
    rHigh         = math.max(startPrice, endPrice)

    rangeLow       := rLow
    rangeHigh      := rHigh
    rangeActive    := true
    barsSinceRange := 0
    hasBrokenOut   := false

    rngColor = dirNow == 1 ? color.new(color.teal, 85) : color.new(color.orange, 85)
    currentBox := box.new(left=startBarIndex, right=bar_index, top=rangeHigh, bottom=rangeLow,
                          border_color=color.new(color.gray, 0), bgcolor=rngColor)

if rangeActive
    barsSinceRange += 1
    if not na(currentBox)
        box.set_right(currentBox, bar_index)
    if streakLen > maxConsecutive and barstate.isconfirmed
        rangeActive    := false
        barsSinceRange := na
        hasBrokenOut   := false
        if not na(currentBox)
            box.delete(currentBox)
            currentBox := na

// === BREAKOUT DETECTION ===
insideRange    = rangeActive and open > rangeLow and open < rangeHigh
brokeUp        = rangeActive and close > rangeHigh
brokeDown      = rangeActive and close < rangeLow
isBreakoutBar  = insideRange and (brokeUp or brokeDown)
hasBrokenOut   := isBreakoutBar ? true : hasBrokenOut

// === ENTRY LOGIC ===
entryCondition = canTrade and isBreakoutBar

// Buffers for R-level line drawing
var float bufferedEntry = na
var float bufferedRiskPts = na
var bool bufferedLong = false

if entryCondition and barstate.isconfirmed
    long      = brokeUp
    entry     = close
    stopPrice = (rangeLow + rangeHigh) * 0.5
    riskPts   = math.abs(entry - stopPrice)
    dollarsPerPoint = syminfo.pointvalue
    riskPerUnitUSD  = riskPts * dollarsPerPoint
    rawQty          = (riskPerUnitUSD > 0) ? (riskAmount / riskPerUnitUSD) : na
    qty             = na(rawQty) ? na : math.round(rawQty, 4)
    takeProfit      = entry + (long ? 1 : -1) * (riskReward * riskPts)

    if not na(qty) and qty > 0
        if long
            strategy.entry("Long", strategy.long, qty=qty, comment="Long")
            strategy.exit("TP/SL", from_entry="Long", limit=takeProfit, stop=stopPrice)
        else
            strategy.entry("Short", strategy.short, qty=qty, comment="Short")
            strategy.exit("TP/SL", from_entry="Short", limit=takeProfit, stop=stopPrice)

        // Buffer values to draw R lines next bar
        bufferedEntry := entry
        bufferedRiskPts := riskPts
        bufferedLong := long

        // Save 1R price and reset SL flag
        oneRPrice := long ? entry + riskPts : entry - riskPts
        movedToBE := false

        // consume the range
        rangeActive    := false
        barsSinceRange := na
        hasBrokenOut   := false
        if not na(currentBox)
            box.set_border_color(currentBox, color.new(color.blue, 0))
            currentBox := na

// === TRAILING STOP TO BREAKEVEN AT 1R ===
if strategy.opentrades > 0 and not movedToBE
    isLong  = strategy.position_size > 0
    isShort = strategy.position_size < 0
    avgEntry = strategy.opentrades.entry_price(0)

    if isLong and close >= oneRPrice
        strategy.exit("Move SL to BE", from_entry="Long", stop=avgEntry)
        movedToBE := true
    if isShort and close <= oneRPrice
        strategy.exit("Move SL to BE", from_entry="Short", stop=avgEntry)
        movedToBE := true

// === R-LINE DRAWING ===
if not na(bufferedEntry) and inBT
    if bufferedLong
        line.new(bar_index, bufferedEntry + 1 * bufferedRiskPts, bar_index + 10, bufferedEntry + 1 * bufferedRiskPts, color=color.rgb(255, 0, 221), width=1, style=line.style_dotted)
        line.new(bar_index, bufferedEntry + 2 * bufferedRiskPts, bar_index + 10, bufferedEntry + 2 * bufferedRiskPts, color=color.rgb(255, 162, 0), width=1, style=line.style_dotted)
        line.new(bar_index, bufferedEntry + 3 * bufferedRiskPts, bar_index + 10, bufferedEntry + 3 * bufferedRiskPts, color=color.rgb(9, 255, 0), width=1, style=line.style_dashed)
    else
        line.new(bar_index, bufferedEntry - 1 * bufferedRiskPts, bar_index + 10, bufferedEntry - 1 * bufferedRiskPts, color=color.rgb(255, 0, 221), width=1, style=line.style_dotted)
        line.new(bar_index, bufferedEntry - 2 * bufferedRiskPts, bar_index + 10, bufferedEntry - 2 * bufferedRiskPts, color=color.rgb(255, 162, 0), width=1, style=line.style_dotted)
        line.new(bar_index, bufferedEntry - 3 * bufferedRiskPts, bar_index + 10, bufferedEntry - 3 * bufferedRiskPts, color=color.rgb(9, 255, 0), width=1, style=line.style_dashed)

    // Reset buffers
    bufferedEntry := na
    bufferedRiskPts := na
    bufferedLong := false

// === FAILSAFE ===
if rangeActive and barsSinceRange > maxBarsToWait and barstate.isconfirmed
    rangeActive    := false
    barsSinceRange := na
    hasBrokenOut   := false
    if not na(currentBox)
        box.delete(currentBox)
        currentBox := na

// === TIME-BASED EXIT (after 2 days on 15min chart = 192 bars) ===
maxBarsInTrade = 192
if strategy.opentrades > 0
    entryBar = strategy.opentrades.entry_bar_index(0)
    if bar_index - entryBar >= maxBarsInTrade
        strategy.close(id="Long", comment="Time-based exit")
        strategy.close(id="Short", comment="Time-based exit")

// === CLEANUP AT BACKTEST END ===
if justLeftBT
    if rangeActive
        rangeActive := false
        if not na(currentBox)
            box.delete(currentBox)
            currentBox := na
    if forceFlatEnd and strategy.position_size != 0 and barstate.isconfirmed
        strategy.close_all(comment="Backtest window ended")

// === VISUALS ===
boUp   = entryCondition and brokeUp
boDown = entryCondition and brokeDown
barcolor(boUp ? color.blue : boDown ? color.yellow : na)
plotshape(boUp,   title="Breakout Up",   style=shape.triangleup,   color=color.lime, size=size.tiny, location=location.belowbar, text="▲ BO")
plotshape(boDown, title="Breakout Down", style=shape.triangledown, color=color.red,  size=size.tiny, location=location.abovebar, text="▼ BO")