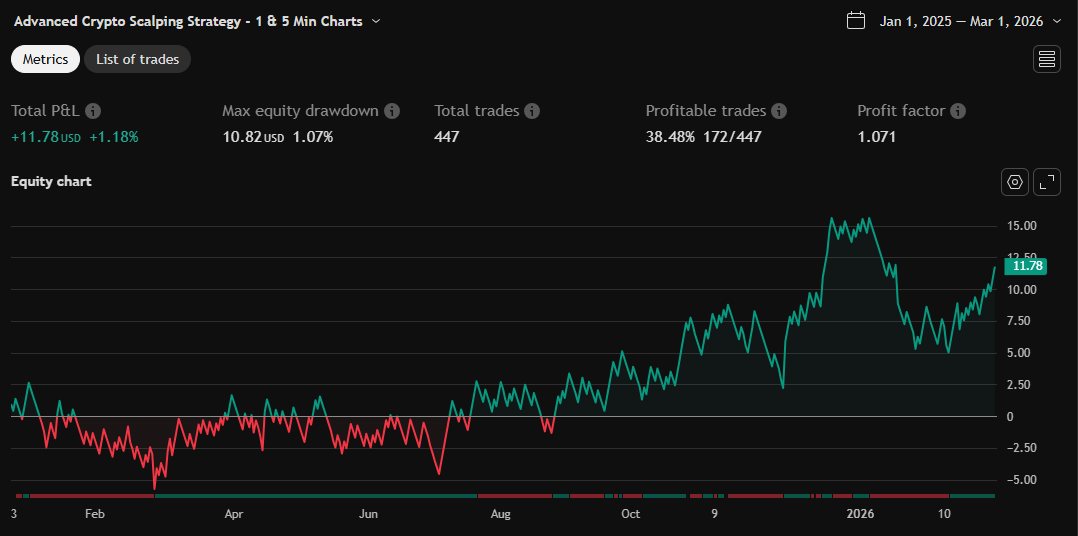
Hilly 3.0 Advanced Crypto Scalping Strategy - 1 & 5 Min Charts
ลิงก์ TradingView
คำอธิบาย
How to Use
Copy the Code: Copy the script above.
Paste in TradingView: Open TradingView, go to the Pine Editor (bottom of the chart), paste the code, and click “Add to Chart.”
Check for Errors: Verify no errors appear in the Pine Editor console. The script uses Pine Script v5 (@version=5).
Select Timeframe:
1-Minute Chart: Use defaults (emaFastLen=7, emaSlowLen=14, rsiLen=10, rsiOverbought=80, rsiOversold=20, slPerc=0.5, tpPerc=1.0, useCandlePatterns=false, patternLookback=10).
5-Minute Chart: Adjust to emaFastLen=9, emaSlowLen=21, rsiLen=14, rsiOverbought=75, rsiOversold=25, slPerc=0.8, tpPerc=1.5, useCandlePatterns=true, patternLookback=10.
Apply to Chart: Use a liquid crypto pair (e.g., BTC/USDT, ETH/USDT on Binance or Coinbase).
Verify Signals:
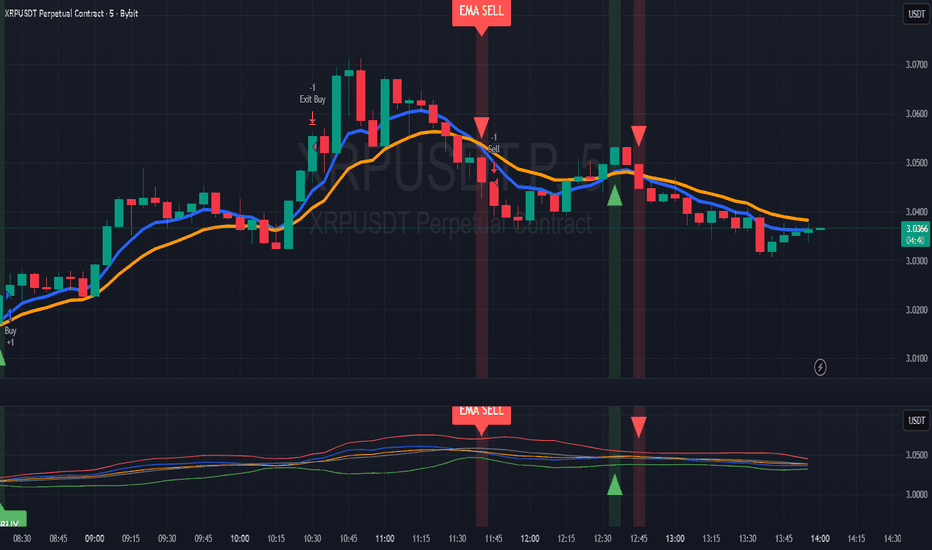
Green “BUY” or “EMA BUY” labels and triangle-up arrows below candles for bullish signals (EMA crossovers, bullish engulfing, hammer, doji, morning star, three white soldiers, double bottom).
Red “SELL” or “EMA SELL” labels and triangle-down arrows above candles for bearish signals (EMA crossovers, bearish engulfing, shooting star, doji, evening star, three black crows, double top).
Green/red background highlights for signal candles.
Backtest: Use TradingView’s Strategy Tester to evaluate performance over 1–3 months, checking Net Profit, Win Rate, and Drawdown.
Demo Test: Run on a demo account to confirm signal visibility and performance before trading with real funds.
รูป Preview
Pine Script Source
//@version=5
// This Pine Script® code is subject to the terms of the Mozilla Public License 2.0 at https://mozilla.org/MPL/2.0/
// © Hilly1976
strategy("Advanced Crypto Scalping Strategy - 1 & 5 Min Charts", overlay=true, margin_long=100, margin_short=100)

// Inputs for customization (optimized for 1-min and 5-min timeframes)
emaFastLen = input.int(7, "Fast EMA Length", minval=1, tooltip="Use 5-8 for 1-min, 7-10 for 5-min")
emaSlowLen = input.int(14, "Slow EMA Length", minval=1, tooltip="Use 10-15 for 1-min, 14-21 for 5-min")
rsiLen = input.int(10, "RSI Length", minval=1, tooltip="Use 8-12 for 1-min, 10-14 for 5-min")
rsiOverbought = input.int(80, "RSI Overbought", minval=50, maxval=100, tooltip="Use 80-85 for 1-min, 75-80 for 5-min")
rsiOversold = input.int(20, "RSI Oversold", minval=0, maxval=50, tooltip="Use 15-20 for 1-min, 20-25 for 5-min")
macdFast = input.int(8, "MACD Fast Length", minval=1, tooltip="Use 6-10 for 1-min, 8-12 for 5-min")
macdSlow = input.int(21, "MACD Slow Length", minval=1, tooltip="Use 15-21 for 1-min, 21-26 for 5-min")
macdSignal = input.int(5, "MACD Signal Smoothing", minval=1, tooltip="Use 4-6 for 1-min, 5-9 for 5-min")
bbLen = input.int(15, "Bollinger Bands Length", minval=1, tooltip="Use 10-15 for 1-min, 15-20 for 5-min")
bbMult = input.float(1.8, "Bollinger Bands Multiplier", minval=0.1, step=0.1, tooltip="Use 1.5-1.8 for 1-min, 1.8-2.0 for 5-min")
slPerc = input.float(0.5, "Stop Loss %", minval=0.1, step=0.1, tooltip="Use 0.3-0.6 for 1-min, 0.5-0.8 for 5-min")
tpPerc = input.float(1.0, "Take Profit %", minval=0.5, step=0.1, tooltip="Use 0.8-1.2 for 1-min, 1.0-1.5 for 5-min")
useCandlePatterns = input.bool(false, "Use Candlestick Patterns", tooltip="Disable for 1-min to reduce noise, enable for 5-min")
useVolumeFilter = input.bool(true, "Use Volume Filter", tooltip="Enable for both timeframes to filter low-volume signals")
signalSize = input.float(2.0, "Signal Arrow Size", minval=1.0, maxval=3.0, step=0.5, tooltip="1.0=tiny, 2.0=small, 3.0=normal")
bgTransparency = input.int(85, "Background Highlight Transparency", minval=0, maxval=100)
labelOffset = input.float(0.8, "Label Offset %", minval=0.5, maxval=5, step=0.1)
patternLookback = input.int(10, "Pattern Lookback Period", minval=5, maxval=20, tooltip="Lookback for chart patterns (double top/bottom)")

// Calculate indicators
emaFast = ta.ema(close, emaFastLen)
emaSlow = ta.ema(close, emaSlowLen)
rsi = ta.rsi(close, rsiLen)
[macdLine, signalLine, _] = ta.macd(close, macdFast, macdSlow, macdSignal)
[bbMid, bbUpper, bbLower] = ta.bb(close, bbLen, bbMult)
volMa = ta.sma(volume, 15)

// Trend determination
bullTrend = close > emaFast and emaFast > emaSlow
bearTrend = close < emaFast and emaFast < emaSlow

// EMA crossover signals
emaCrossBuy = ta.crossover(emaFast, emaSlow)
emaCrossSell = ta.crossunder(emaFast, emaSlow)

// Momentum signals
bullMacd = ta.crossover(macdLine, signalLine) and macdLine > 0
bearMacd = ta.crossunder(macdLine, signalLine) and macdLine < 0

// Channel breakouts
bullBreak = ta.crossover(close, bbUpper)
bearBreak = ta.crossunder(close, bbLower)

// RSI conditions
bullRsi = rsi > 50 and rsi < rsiOverbought
bearRsi = rsi < 50 and rsi > rsiOversold

// Candlestick patterns (optional, less reliable on 1-min)
bullEngulf = close > open and open < low[1] and close > high[1] and useCandlePatterns
bearEngulf = close < open and open > high[1] and close < low[1] and useCandlePatterns
hammer = (high - low) > 2 * (close - open) and close > open and (close - low) / (high - low) > 0.6 and useCandlePatterns
shootingStar = (high - low) > 2 * (open - close) and close < open and (high - close) / (high - low) > 0.6 and useCandlePatterns
doji = math.abs(close - open) <= (high - low) * 0.1 and useCandlePatterns
morningStar = close[2] < open[2] and math.abs(close[1] - open[1]) <= (high[1] - low[1]) * 0.3 and close > open and close > close[2] and useCandlePatterns
eveningStar = close[2] > open[2] and math.abs(close[1] - open[1]) <= (high[1] - low[1]) * 0.3 and close < open and close < close[2] and useCandlePatterns

// Reversal patterns
threeWhiteSoldiers = close > open and close[1] > open[1] and close[2] > open[2] and close > close[1] and close[1] > close[2] and useCandlePatterns
threeBlackCrows = close < open and close[1] < open[1] and close[2] < open[2] and close < close[1] and close[1] < close[2] and useCandlePatterns

// Chart patterns (simplified double top/bottom)
swingLow1 = ta.lowest(low, patternLookback)
swingLow2 = ta.lowest(low[patternLookback], patternLookback)
swingHigh1 = ta.highest(high, patternLookback)
swingHigh2 = ta.highest(high[patternLookback], patternLookback)
doubleBottom = swingLow1 >= swingLow2 * 0.99 and swingLow1 <= swingLow2 * 1.01 and low > low[1] and useCandlePatterns
doubleTop = swingHigh1 <= swingHigh2 * 1.01 and swingHigh1 >= swingHigh2 * 0.99 and high < high[1] and useCandlePatterns

bullCandle = bullEngulf or hammer or doji or morningStar or threeWhiteSoldiers or doubleBottom
bearCandle = bearEngulf or shootingStar or doji or eveningStar or threeBlackCrows or doubleTop

// Volume filter
volFilter = volume > volMa * 1.8 or not useVolumeFilter

// Combined buy/sell conditions
mainBuyCondition = bullTrend and bullMacd and bullBreak and bullRsi and bullCandle and volFilter
mainSellCondition = bearTrend and bearMacd and bearBreak and bearRsi and bearCandle and volFilter
buyCondition = mainBuyCondition or emaCrossBuy
sellCondition = mainSellCondition or emaCrossSell

// Strategy entries
var bool isBuyActive = false
var bool isSellActive = false

if (buyCondition and strategy.position_size == 0 and not isBuyActive)
    strategy.entry("Buy", strategy.long)
    label.new(bar_index, low * (1 - labelOffset / 100), emaCrossBuy ? "EMA BUY" : "BUY", color=color.green, style=label.style_label_up, textcolor=color.white, size=size.large)
    isBuyActive := true
    isSellActive := false

if (sellCondition and strategy.position_size == 0 and not isSellActive)
    strategy.entry("Sell", strategy.short)
    label.new(bar_index, high * (1 + labelOffset / 100), emaCrossSell ? "EMA SELL" : "SELL", color=color.red, style=label.style_label_down, textcolor=color.white, size=size.large)
    isSellActive := true
    isBuyActive := false

// Exits
if (strategy.position_size > 0) // Long position
    strategy.exit("Exit Buy", "Buy", stop=strategy.position_avg_price * (1 - slPerc / 100), limit=strategy.position_avg_price * (1 + tpPerc / 100))
    if (strategy.position_size == 0)
        isBuyActive := false

if (strategy.position_size < 0) // Short position
    strategy.exit("Exit Sell", "Sell", stop=strategy.position_avg_price * (1 + slPerc / 100), limit=strategy.position_avg_price * (1 - tpPerc / 100))
    if (strategy.position_size == 0)
        isSellActive := false

// Plot indicators
plot(emaFast, color=color.blue, title="Fast EMA")
plot(emaSlow, color=color.orange, title="Slow EMA")
plot(bbUpper, color=color.red, title="BB Upper")
plot(bbMid, color=color.gray, title="BB Mid")
plot(bbLower, color=color.green, title="BB Lower")

// Plot signals with fixed size to avoid type mismatch
plotshape(buyCondition, title="Buy Signal", location=location.belowbar, color=color.green, style=shape.triangleup, size=size.normal)
plotshape(sellCondition, title="Sell Signal", location=location.abovebar, color=color.red, style=shape.triangledown, size=size.normal)

// Background highlights
bgcolor(buyCondition ? color.new(color.green, bgTransparency) : sellCondition ? color.new(color.red, bgTransparency) : na)