RedFlag
ลิงก์ TradingView
คำอธิบาย
Counter-trend strategy
Condition to open a long position:
Buys if the price drops by a specified percentage from the previous candle’s close. Only one purchase can be made within a single candle.
Condition to close a position:
Places a separate individual closing limit order for each purchase, or uses one common take-profit order for the whole position.
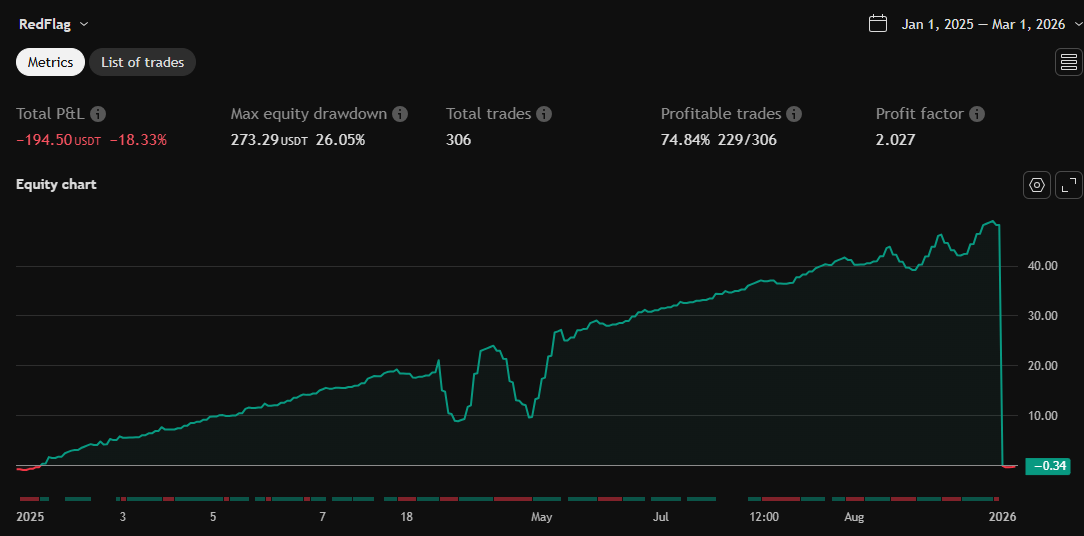
⚠️ Attention : Stop-loss is not implemented in the current first version of the strategy.
Options description:
Drop_percent , % — Percentage drop in price from the From point
From — The reference point on the closed candle from which the Drop_percent is calculated (Open, Close, High, Low)
Tp , % — Take-profit level as a percentage
Count — Number of allowed additional purchases (scaling in)
Each_tp — Mode switch:
True — a separate take-profit is placed for each purchase
False — one common take-profit is placed based on the average entry price of the position
รูป Preview
Pine Script Source
// This Pine Script® code is subject to the terms of the Mozilla Public License 2.0 at https://mozilla.org/MPL/2.0/
// © hamster-bot

//@version=5
strategy("RedFlag", overlay=true, fill_orders_on_standard_ohlc = true, calc_on_every_tick = true, pyramiding = 999, initial_capital = 1000)
drop_percent = input.float(0.15, step=0.01)
from = input.source(close)
tp = input.float(0.15, step=0.01)
count = input.int(6, step=1, minval=1, title="count", inline="lot") - 1
each_tp = input.bool(true)

timestamp_start = input.time(defval = timestamp("01 Jan 2014 00:00 +0000"), title = "Time Start", inline="time")
timestamp_end = input.time(defval = timestamp("30 Dec 2050 23:59 +0000"), title = "Time End  ", inline="time")
truetime = time > timestamp_start and time < timestamp_end

red_candle_size = close < open ? (math.abs(close - open) / open) * 100 : na
// Считаем среднее значение только для красных свечей
average_red_size = ta.sma(red_candle_size, 100)

PRICE_TRIGGER = from * (100 - drop_percent) / 100
PRICE_TP = each_tp ? from * (100 + tp) / 100 : strategy.position_avg_price * (100 + tp) / 100

plot(PRICE_TRIGGER, "Open", offset = 1, style = plot.style_stepline, color = color.lime)
plot(PRICE_TP, "Close", offset = 1, style = plot.style_stepline, color = color.fuchsia)
plot(strategy.position_avg_price, "position_avg_price")

var x = 0.0
if strategy.opentrades>strategy.opentrades[1]
    x := x + 1
else if strategy.opentrades==0
    x := 0

var size = 0.0
if strategy.opentrades!=strategy.opentrades[1] and strategy.opentrades[1]==0
    size := strategy.position_size

bool EntryLong = strategy.opentrades==0 and strategy.position_size==0
bool PurchasesLong = strategy.position_size > 0 and x<=count
bool CancelPurchasesLong = strategy.position_size==0 and strategy.opentrades==0

// Массивы для хранения данных по сделкам
var string[] tradeIDs = array.new_string()

// Функция добавления сделки
add_trade(entry, tp_) =>
    tradeId = "Trade_" + str.tostring(bar_index)
    strategy.entry(tradeId, strategy.long, limit = entry)
    strategy.exit("TP_" + tradeId, tradeId, limit=tp_)

if each_tp
    if truetime
        switch
            EntryLong => add_trade(PRICE_TRIGGER, PRICE_TP)
            PurchasesLong => add_trade(PRICE_TRIGGER, PRICE_TP)

    strategy.cancel("Trade_" + str.tostring(bar_index - 1))

if each_tp == false
    if truetime
        switch
            EntryLong => strategy.entry("L", strategy.long, limit = PRICE_TRIGGER)
            PurchasesLong => strategy.entry("L+", strategy.long, qty=size, limit = PRICE_TRIGGER)
        strategy.exit("TPL", qty_percent = 100, limit = PRICE_TP)

///////////////////
// MONTHLY TABLE //
prec = 2

new_month = month(time) != month(time[1])
new_year  = year(time)  != year(time[1])

eq = strategy.equity

bar_pnl = eq / eq[1] - 1

cur_month_pnl = 0.0
cur_year_pnl  = 0.0

// Current Monthly P&L
cur_month_pnl := new_month ? 0.0 :
                 (1 + cur_month_pnl[1]) * (1 + bar_pnl) - 1

// Current Yearly P&L
cur_year_pnl := new_year ? 0.0 :
                 (1 + cur_year_pnl[1]) * (1 + bar_pnl) - 1

// Arrays to store Yearly and Monthly P&Ls
var month_pnl  = array.new_float(0)
var month_time = array.new_int(0)

var year_pnl  = array.new_float(0)
var year_time = array.new_int(0)

last_computed = false

if (not na(cur_month_pnl[1]) and (new_month or barstate.islast))
    if (last_computed[1])
        array.pop(month_pnl)
        array.pop(month_time)

    array.push(month_pnl , cur_month_pnl[1])
    array.push(month_time, time[1])

if (not na(cur_year_pnl[1]) and (new_year or barstate.islast))
    if (last_computed[1])
        array.pop(year_pnl)
        array.pop(year_time)

    array.push(year_pnl , cur_year_pnl[1])
    array.push(year_time, time[1])

last_computed := barstate.islast ? true : nz(last_computed[1])

// Monthly P&L Table
var monthly_table = table(na)

if (barstate.islast)
    label.new(bar_index, high * 1.02, text="Average Red %: " + str.tostring(average_red_size, "#.###"), style=label.style_label_down, color=color.rgb(0, 0, 0), textcolor=color.white, size=size.normal)

    monthly_table := table.new(position.bottom_right, columns = 14, rows = array.size(year_pnl) + 1, border_width = 1)

    table.cell(monthly_table, 0,  0, "",     bgcolor = #cccccc)
    table.cell(monthly_table, 1,  0, "Jan",  bgcolor = #cccccc)
    table.cell(monthly_table, 2,  0, "Feb",  bgcolor = #cccccc)
    table.cell(monthly_table, 3,  0, "Mar",  bgcolor = #cccccc)
    table.cell(monthly_table, 4,  0, "Apr",  bgcolor = #cccccc)
    table.cell(monthly_table, 5,  0, "May",  bgcolor = #cccccc)
    table.cell(monthly_table, 6,  0, "Jun",  bgcolor = #cccccc)
    table.cell(monthly_table, 7,  0, "Jul",  bgcolor = #cccccc)
    table.cell(monthly_table, 8,  0, "Aug",  bgcolor = #cccccc)
    table.cell(monthly_table, 9,  0, "Sep",  bgcolor = #cccccc)
    table.cell(monthly_table, 10, 0, "Oct",  bgcolor = #cccccc)
    table.cell(monthly_table, 11, 0, "Nov",  bgcolor = #cccccc)
    table.cell(monthly_table, 12, 0, "Dec",  bgcolor = #cccccc)
    table.cell(monthly_table, 13, 0, "Year", bgcolor = #999999)


    for yi = 0 to array.size(year_pnl) - 1
        table.cell(monthly_table, 0,  yi + 1, str.tostring(year(array.get(year_time, yi))), bgcolor = #cccccc)

        y_color = array.get(year_pnl, yi) > 0 ? color.new(color.green, transp = 50) : color.new(color.red, transp = 50)
        table.cell(monthly_table, 13, yi + 1, str.tostring(math.round(array.get(year_pnl, yi) * 100, prec)), bgcolor = y_color)

    for mi = 0 to array.size(month_time) - 1
        m_row   = year(array.get(month_time, mi))  - year(array.get(year_time, 0)) + 1
        m_col   = month(array.get(month_time, mi))
        m_color = array.get(month_pnl, mi) > 0 ? color.new(color.green, transp = 70) : color.new(color.red, transp = 70)

        table.cell(monthly_table, m_col, m_row, str.tostring(math.round(array.get(month_pnl, mi) * 100, prec)), bgcolor = m_color)