Momentum Breakout Strategy
ลิงก์ TradingView

คำอธิบาย
Backtest a strategy where, when a candlestick on a timeframe rises more than a certain %, it enters a trade.
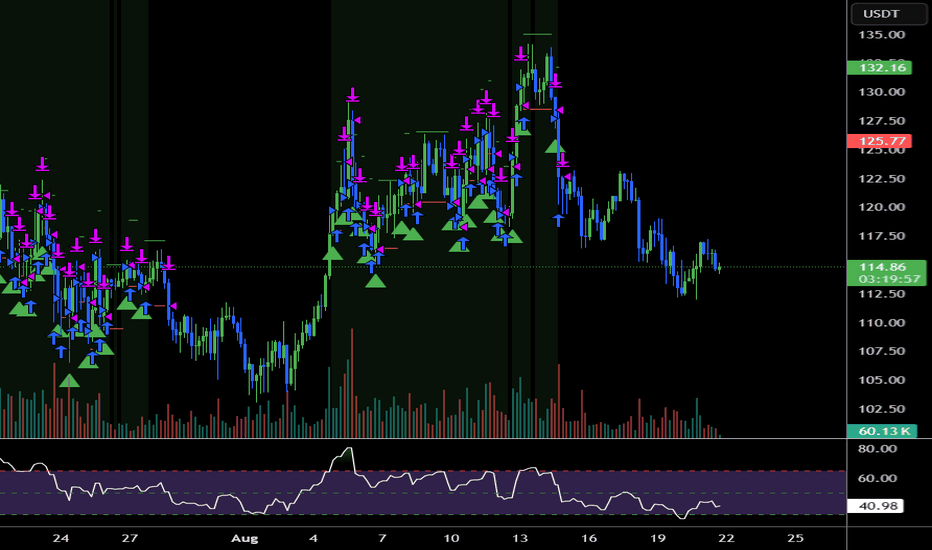
รูป Preview
Pine Script Source
//@version=5
strategy("Momentum Breakout Strategy", overlay=true, initial_capital=10000, default_qty_type=strategy.percent_of_equity, default_qty_value=10)

// Input parameters
sl_percent = input.float(1.5, title="Stop Loss %", minval=0.1, maxval=10.0, step=0.1)
tp_percent = input.float(3.5, title="Take Profit %", minval=0.1, maxval=20.0, step=0.1)
momentum_threshold = input.float(5.0, title="Momentum Threshold %", minval=1.0, maxval=20.0, step=0.5)
lookback_bars = input.int(48, title="Lookback Bars (4h = 48 bars on 5min chart)", minval=1, maxval=200)

// Calculate price change percentage over lookback period
price_change_pct = ((close - close[lookback_bars]) / close[lookback_bars]) * 100

// Entry condition: Price moved up by momentum_threshold% or more
long_condition = price_change_pct >= momentum_threshold and strategy.position_size == 0

// Calculate stop loss and take profit levels
var float entry_price = na
var float stop_loss = na
var float take_profit = na

if long_condition
    entry_price := close
    stop_loss := entry_price * (1 - sl_percent / 100)
    take_profit := entry_price * (1 + tp_percent / 100)
    strategy.entry("Long", strategy.long)

// Exit conditions
if strategy.position_size > 0
    strategy.exit("Exit Long", "Long", stop=stop_loss, limit=take_profit)

// Plot entry signals
plotshape(long_condition, style=shape.triangleup, location=location.belowbar, color=color.green, size=size.small, title="Buy Signal")

// Plot stop loss and take profit levels
plot(strategy.position_size > 0 ? stop_loss : na, color=color.red, style=plot.style_linebr, linewidth=1, title="Stop Loss")
plot(strategy.position_size > 0 ? take_profit : na, color=color.green, style=plot.style_linebr, linewidth=1, title="Take Profit")

// Plot momentum line
hline(0, "Zero Line", color=color.gray, linestyle=hline.style_dashed)
momentum_plot = plot(price_change_pct, title="Price Change %", color=price_change_pct >= momentum_threshold ? color.green : color.red, linewidth=2)
hline(momentum_threshold, "Momentum Threshold", color=color.yellow, linestyle=hline.style_dashed)

// Background color for momentum signals
bgcolor(price_change_pct >= momentum_threshold ? color.new(color.green, 90) : na, title="Momentum Background")

// Display current values in a table
if barstate.islast
    var table info_table = table.new(position.top_right, 2, 4, bgcolor=color.white, border_width=1)
    table.cell(info_table, 0, 0, "Current Momentum:", text_color=color.black, bgcolor=color.white)
    table.cell(info_table, 1, 0, str.tostring(price_change_pct, "#.##") + "%", text_color=price_change_pct >= momentum_threshold ? color.green : color.red, bgcolor=color.white)
    table.cell(info_table, 0, 1, "Position Size:", text_color=color.black, bgcolor=color.white)
    table.cell(info_table, 1, 1, str.tostring(strategy.position_size, "#.####"), text_color=color.black, bgcolor=color.white)
    table.cell(info_table, 0, 2, "Entry Price:", text_color=color.black, bgcolor=color.white)
    table.cell(info_table, 1, 2, strategy.position_size > 0 ? str.tostring(entry_price, "#.##") : "N/A", text_color=color.black, bgcolor=color.white)
    table.cell(info_table, 0, 3, "P&L:", text_color=color.black, bgcolor=color.white)
    table.cell(info_table, 1, 3, str.tostring(strategy.netprofit, "#.##"), text_color=strategy.netprofit > 0 ? color.green : color.red, bgcolor=color.white)