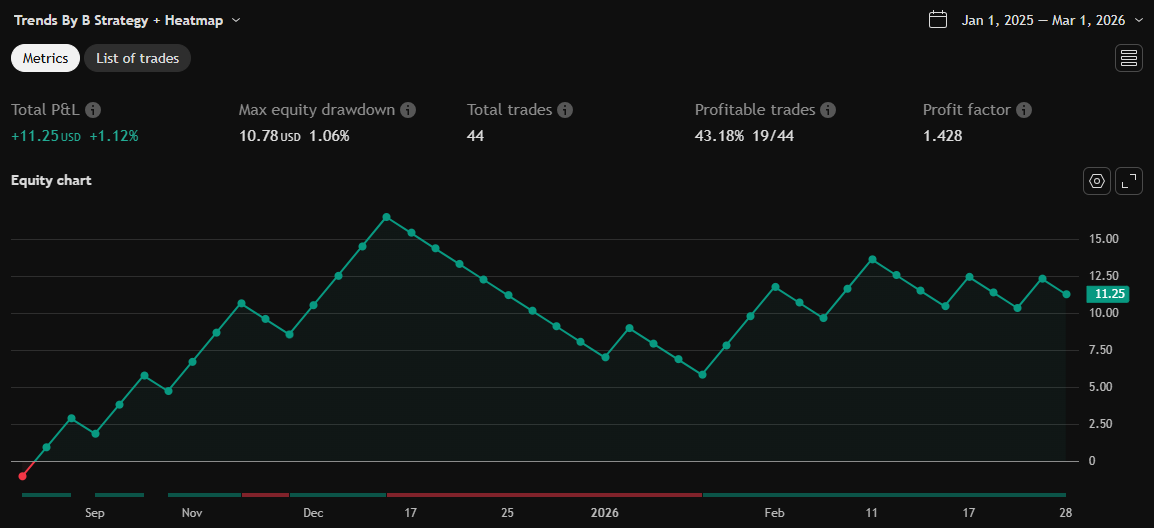
Trends By B Strategy + Heatmap
ลิงก์ TradingView
คำอธิบาย
It shows the trend of the token currently open on the chart for 5m, 15m, 30m, 1h, 2h, 4h, 6h, 12h, 1d, 1w, and 1 month (displayed in the table on the right).
It indicates when all of them are either green (a total uptrend) or red (a total downtrend).
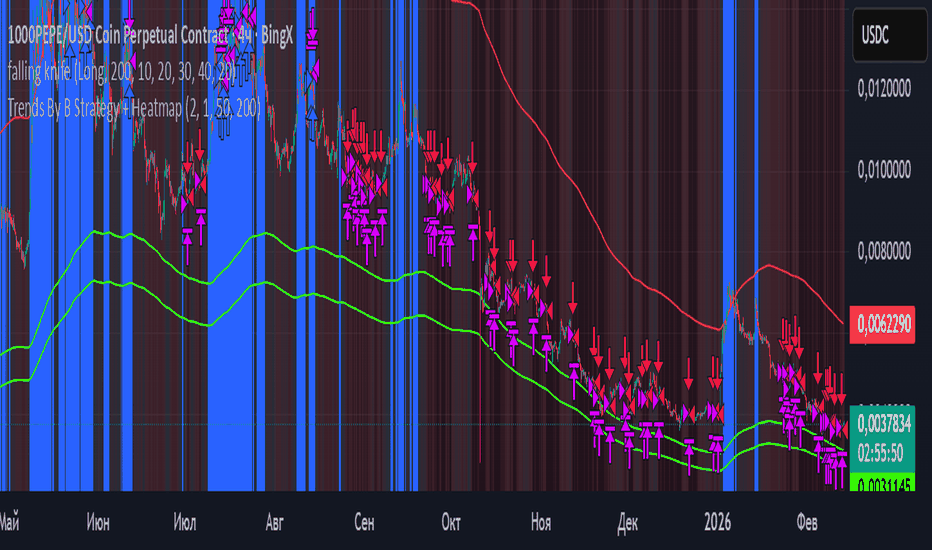
รูป Preview
Pine Script Source
//@version=5
strategy("Trends By B Strategy + Heatmap", overlay=true,
     initial_capital=10000,
     default_qty_type=strategy.percent_of_equity,
     default_qty_value=100)

// ==== TP/SL ====
tpPerc = input.float(2.0, "Take Profit %", step=0.1)
slPerc = input.float(1.0, "Stop Loss %", step=0.1)

// ==== HEATMAP COLORS ====
colStrongDown = input.color(color.rgb(90,0,0), "Heat Strong Down")
colDown       = input.color(color.red, "Heat Down")
colNeutral    = input.color(color.gray, "Heat Neutral")
colUp         = input.color(color.green, "Heat Up")
colStrongUp   = input.color(color.rgb(120,255,120), "Heat Strong Up")

// ==== TIMEFRAMES ====
tf1="5"
tf2="15"
tf3="30"
tf4="60"
tf5="120"
tf6="240"
tf7="360"
tf8="720"
tf9="1440"
tf10="1W"

shortTerm = input(50)
longTerm  = input(200)

sym = syminfo.tickerid

trendCalc(tf)=>
    s=request.security(sym,tf,ta.ema(close,shortTerm))
    l=request.security(sym,tf,ta.ema(close,longTerm))
    s>l?1:-1

// ==== TRENDS ====
trends = array.new_float()
array.push(trends,trendCalc(tf1))
array.push(trends,trendCalc(tf2))
array.push(trends,trendCalc(tf3))
array.push(trends,trendCalc(tf4))
array.push(trends,trendCalc(tf5))
array.push(trends,trendCalc(tf6))
array.push(trends,trendCalc(tf7))
array.push(trends,trendCalc(tf8))
array.push(trends,trendCalc(tf9))
array.push(trends,trendCalc(tf10))

sum=0.0
for i=0 to array.size(trends)-1
    sum+=array.get(trends,i)

trendAvg=sum/array.size(trends)

// ==== MARKET STRENGTH SCALE ====
// -1 → +1   →   -100 → +100
strength = trendAvg * 100

// ==== HEATMAP COLOR BLEND ====
// Плавная интерполяция цвета
heatColor =
     trendAvg <= -0.5 ? color.from_gradient(trendAvg,-1,-0.5,colStrongDown,colDown) :
     trendAvg <= 0 ? color.from_gradient(trendAvg,-0.5,0,colDown,colNeutral) :
     trendAvg <= 0.5 ? color.from_gradient(trendAvg,0,0.5,colNeutral,colUp) :
     color.from_gradient(trendAvg,0.5,1,colUp,colStrongUp)

// Фон графика
bgcolor(color.new(heatColor,80))

// ==== STRATEGY SIGNALS ====
isStrongDown = trendAvg <= -0.8
isStrongUp   = trendAvg >= 0.8

longSignal  = isStrongUp and not isStrongUp[1]
shortSignal = isStrongDown and not isStrongDown[1]

if longSignal
    strategy.close("SHORT")
    strategy.entry("LONG", strategy.long)

if shortSignal
    strategy.close("LONG")
    strategy.entry("SHORT", strategy.short)

// ==== TP SL ====
long_tp  = strategy.position_avg_price * (1 + tpPerc/100)
long_sl  = strategy.position_avg_price * (1 - slPerc/100)
short_tp = strategy.position_avg_price * (1 - tpPerc/100)
short_sl = strategy.position_avg_price * (1 + slPerc/100)

strategy.exit("LX","LONG",limit=long_tp,stop=long_sl)
strategy.exit("SX","SHORT",limit=short_tp,stop=short_sl)

// ==== HEAT SCALE PLOT ====
// Отдельная шкала силы рынка
plot(strength,
     title="Market Strength",
     style=plot.style_columns,
     linewidth=3)

hline(80)
hline(-80)
hline(0)