Buy Signal EMA & RSI Strategy [CocoChoco]
ลิงก์ TradingView
คำอธิบาย
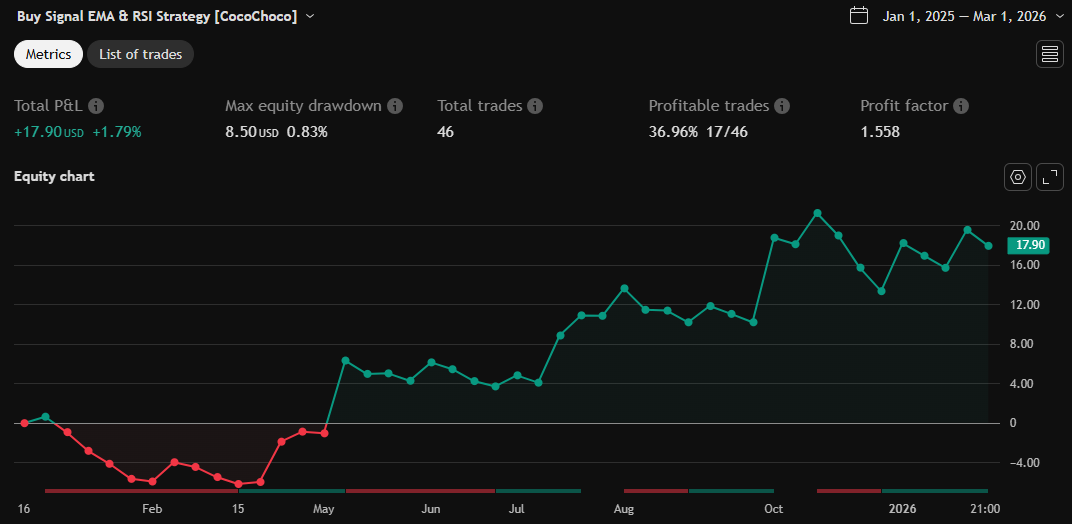
Strategy to back test my published indicator under the same name:
Buy Signal EMA & RSI Strategy
รูป Preview

Pine Script Source
//@version=6
strategy("Buy Signal EMA & RSI Strategy [CocoChoco]", overlay=true, initial_capital=10000, default_qty_type=strategy.percent_of_equity, default_qty_value=100)

// --- USER INPUTS ---
ema50_col  = input.color(color.orange, "EMA 50 Color")
ema200_col = input.color(color.green, "EMA 200 Color")
rsi_min    = input.int(55, "RSI Minimum")
rsi_max    = input.int(80, "RSI Ceiling")
atr_mult   = input.float(2, "ATR Trailing Multiplier")
tsl_col    = input.color(color.new(color.red, 30), "Trailing Stop Color")

// --- CALCULATIONS ---
ema50  = ta.ema(close, 50)
ema200 = ta.ema(close, 200)
rsi    = ta.rsi(close, 25)
[diplus, diminus, adx] = ta.dmi(14, 14)
atr    = ta.atr(14)

// Extract logic to global scope for v6 stability
rsiCross     = ta.crossover(rsi, rsi_min)
rsiRising    = rsi > rsi[1]
volumeFilter = volume > ta.highest(volume, 10)[1]

// --- BUY CONDITION ---
buySignal = (ema50 > ema200) and (close > ema50) and (close > ema200) and
             (rsiCross or rsi > rsi_min) and (rsi < rsi_max) and
             rsiRising and (adx > 20) and volumeFilter

// --- TRAILING STOP LOGIC ---
var float trailingStop = na
if buySignal
    // On a new buy signal, set the initial stop
    trailingStop := close - (atr * atr_mult)
else if strategy.position_size > 0 and not na(trailingStop)
    // Trail upward only while in a position
    trailingStop := math.max(trailingStop, close - (atr * atr_mult))
else
    // Reset stop when not in a trade
    trailingStop := na

// --- STRATEGY EXECUTION ---
if buySignal
    strategy.entry("Long", strategy.long)

// Exit logic: Trigger exit if price closes below the trailing stop
if strategy.position_size > 0 and close < trailingStop
    strategy.close("Long", comment="TSL Hit")

// --- VISUALS ---
plot(ema50, color=ema50_col, linewidth=1, title="EMA 50")
plot(ema200, color=ema200_col, linewidth=2, title="EMA 200")

// Simplified Plot: Standard solid line to ensure zero errors
plot(trailingStop, "Trailing Stop", color=tsl_col, style=plot.style_linebr, linewidth=1)

plotshape(buySignal and strategy.position_size == 0, style=shape.triangleup, location=location.belowbar, color=color.green, size=size.normal, title="Buy Signal")

// --- DASHBOARD ---
var table stats = table.new(position.bottom_right, 2, 2, border_width=1)
if barstate.islast
    table.cell(stats, 0, 0, "RSI", bgcolor=color.gray, text_color=color.white)
    table.cell(stats, 0, 1, str.tostring(rsi, "#.#"), bgcolor=rsi > 50 ? color.green : color.red, text_color=color.white)
    table.cell(stats, 1, 0, "ADX", bgcolor=color.gray, text_color=color.white)
    table.cell(stats, 1, 1, str.tostring(adx, "#.#"), bgcolor=adx > 20 ? color.blue : color.gray, text_color=color.white)

// --- ALERT ---
alertcondition(buySignal, title="BUY Signal", message="Buy Signal")