Bollinger Bands EMA Strategy
ลิงก์ TradingView
คำอธิบาย
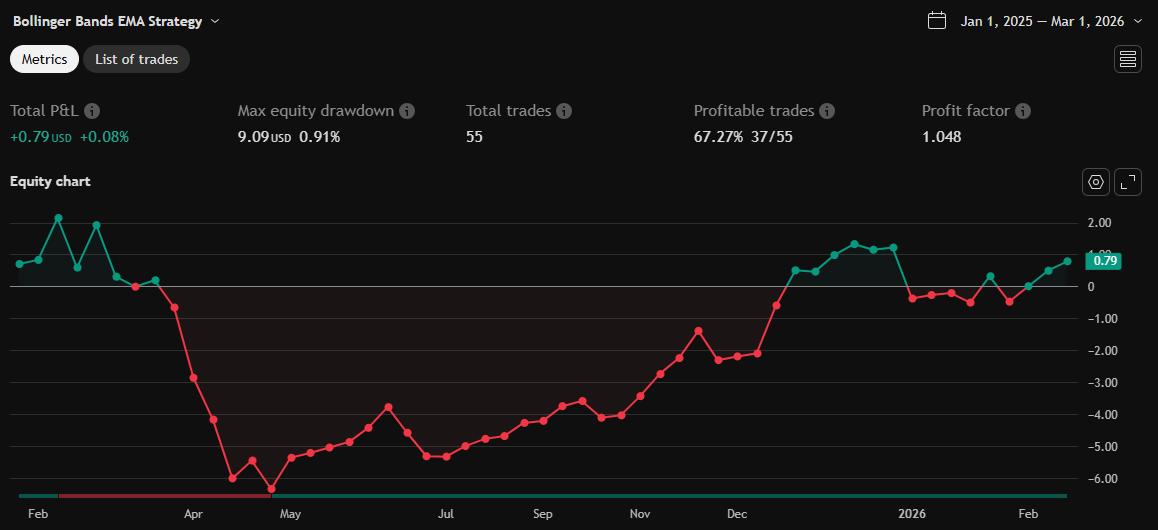
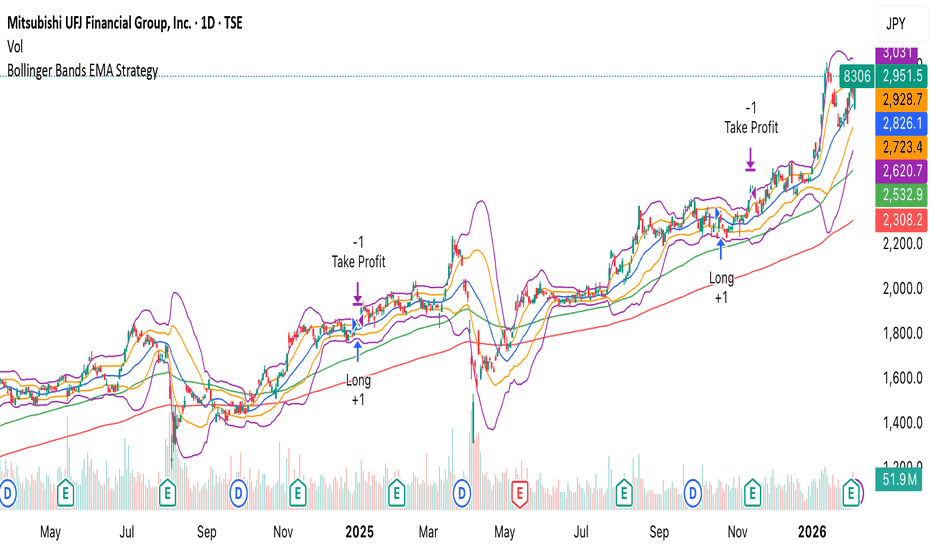
This is a simple script that mainly uses the Bollinger Bands middle line combined with an EMA trend-following strategy as support. It’s an entry-level version, and I’ll release more valuable scripts in the future. Feel free to follow.
รูป Preview
Pine Script Source
//@version=5
strategy("Bollinger Bands EMA Strategy", overlay=true)

// 定义EMA和布林线参数
ema89 = ta.ema(close, 89)
ema200 = ta.ema(close, 200)

// 使用布林带函数,获取布林带的上轨、中轨和下轨
basis1 = ta.sma(close, 20)
dev1 = ta.stdev(close, 20)
bb_upper1 = basis1 + dev1
bb_lower1 = basis1 - dev1

basis2 = ta.sma(close, 20)
dev2 = ta.stdev(close, 20) * 2
bb_upper2 = basis2 + dev2
bb_lower2 = basis2 - dev2

sma20 = ta.sma(close, 20)

// 策略参数
longCondition = ta.crossover(close, sma20) and close > ema89 and close > ema200 and ta.lowest(close, 10) <= bb_lower2 and ta.lowest(close, 5) <= bb_lower1
shortCondition = ta.crossunder(close, sma20) and close < ema89 and close < ema200 and ta.highest(close, 10) >= bb_upper2 and ta.highest(close, 5) >= bb_upper1

// 进场点(多头)
if (longCondition)
    strategy.entry("Long", strategy.long)
    strategy.exit("Take Profit", "Long", limit=bb_upper2, stop=bb_lower2)

// 进场点(空头)
if (shortCondition)
    strategy.entry("Short", strategy.short)
    strategy.exit("Take Profit", "Short", limit=bb_lower2, stop=bb_upper2)

// 绘制均线和布林带
plot(ema89, title="89 EMA", color=color.green)
plot(ema200, title="200 EMA", color=color.red)
plot(sma20, title="20 SMA", color=color.blue)
plot(bb_upper1, title="Bollinger Bands (1x Upper)", color=color.orange)
plot(bb_lower1, title="Bollinger Bands (1x Lower)", color=color.orange)
plot(bb_upper2, title="Bollinger Bands (2x Upper)", color=color.purple)
plot(bb_lower2, title="Bollinger Bands (2x Lower)", color=color.purple)