KAPISH Weekly Open + Trailing SL
ลิงก์ TradingView
คำอธิบาย
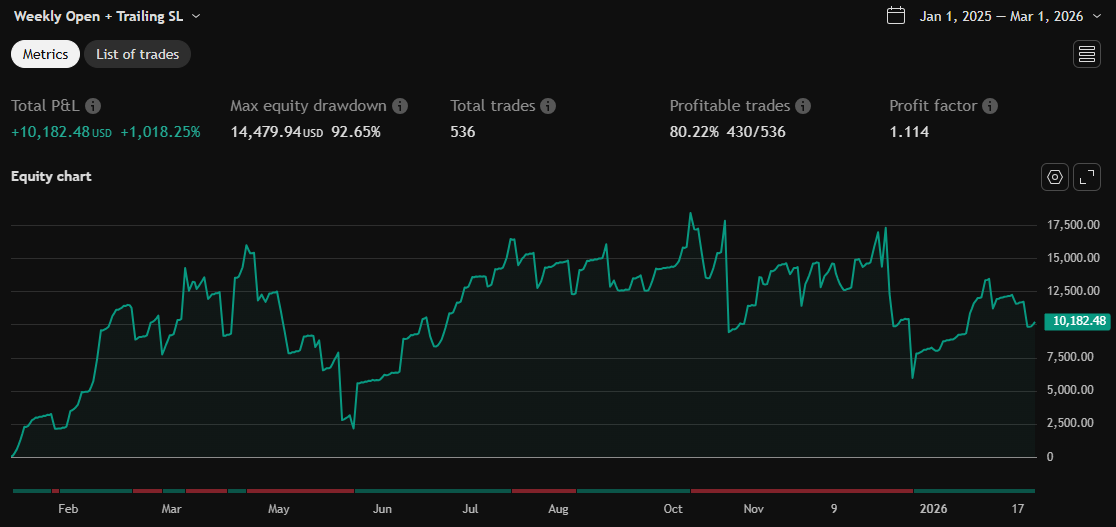
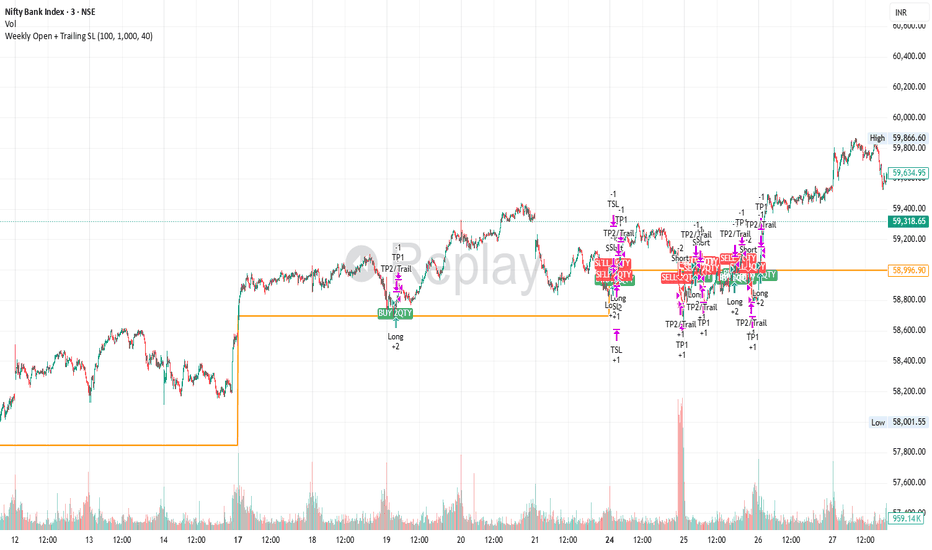
This script is a highly precise, rule-based breakout strategy designed to trade the Weekly Open price level. It is built for a "Jane Street" style of disciplined execution, meaning it prioritizes confirmation over speed to avoid market noise and "fakeouts."Here is the structural breakdown of how the script functions:1. The Core Anchor: Weekly OpenThe strategy uses the Weekly Open as its "Fair Value" line.It assumes that if price holds above the Weekly Open, the weekly trend is bullish.If price holds below, the trend is bearish.It applies your 0.01 buffer to ensure the breakout is meaningful and not just a "touch" of the level.2. The Precision Filter: 2-Candle DelayThis is the most critical part of the logic. Most retail traders enter the moment a level is crossed. This script does the opposite:Step 1: Price crosses the Weekly Open $\pm$ 0.01. (Marked by a tiny gray circle).Step 2: The script waits for two full candles to close.Step 3: On the third candle, it checks: "Is price still above/below the Weekly Open?"Result: If yes, it fires the BUY/SELL 2QTY signal. This filters out "stop-hunts" where price spikes and immediately reverses.3. Professional Trade Management (The "Split-Exit")Instead of exiting the whole trade at once, the script manages 2 Units (QTY) differently:Target 1 (TP1): A fixed "offload" point. This is designed to capture quick profit and reduce the risk of the trade.Target 2 (TP2) + Trailing SL: The second unit is the "runner."It aims for a larger target.It utilizes a Trailing Stop Loss that "climbs" behind the price. If price moves 30 points in your favor, the stop loss moves up 30 points automatically.
รูป Preview
Pine Script Source
//@version=5
strategy("Weekly Open + Trailing SL", overlay=true, initial_capital=100000)

// ===== INPUTS =====
tp1Points   = input.int(50, "Target 1 (Points)")
tp2Points   = input.int(100, "Target 2 (Points)")
trailPoints = input.int(30, "Trailing Stop (Points)")
buffer      = 0.01

// ===== FETCH WEEKLY OPEN PRICE =====
w_open = request.security(syminfo.tickerid, "W", open, lookahead=barmerge.lookahead_on)

// ===== 2-CANDLE DELAY LOGIC =====
breakoutBuy  = ta.crossover(close, w_open + buffer)
breakoutSell = ta.crossunder(close, w_open - buffer)

// ENTRY: Requires breakout 2 candles ago and price stays valid
buySignal  = breakoutBuy[2] and close > w_open
sellSignal = breakoutSell[2] and close < w_open

// ===== TRADE EXECUTION (2 QTY) =====
var float initialSlPrice = na
var float tp1Price = na
var float tp2Price = na

if buySignal and strategy.position_size == 0
    initialSlPrice := math.min(low, low[1], low[2])
    tp1Price := close + tp1Points
    tp2Price := close + tp2Points
    strategy.entry("Long", strategy.long, qty=2)

if sellSignal and strategy.position_size == 0
    initialSlPrice := math.max(high, high[1], high[2])
    tp1Price := close - tp1Points
    tp2Price := close - tp2Points
    strategy.entry("Short", strategy.short, qty=2)

// ===== MULTI-TARGET & TRAILING SL LOGIC =====
// Convert points to price offset
trailOffset = trailPoints * syminfo.mintick

if strategy.position_size > 0
    // Target 1: Exit 1 Qty at fixed point
    strategy.exit("TP1", "Long", qty=1, limit=tp1Price, stop=initialSlPrice, comment_profit="TP1", comment_loss="SL")
    // Target 2: Exit 1 Qty with Trailing Stop
    strategy.exit("TP2/Trail", "Long", qty=1, limit=tp2Price, trail_points=trailPoints, trail_offset=trailPoints, stop=initialSlPrice, comment_profit="TP2", comment_loss="TSL")

if strategy.position_size < 0
    strategy.exit("TP1", "Short", qty=1, limit=tp1Price, stop=initialSlPrice, comment_profit="TP1", comment_loss="SL")
    strategy.exit("TP2/Trail", "Short", qty=1, limit=tp2Price, trail_points=trailPoints, trail_offset=trailPoints, stop=initialSlPrice, comment_profit="TP2", comment_loss="TSL")

// ===== PLOTS =====
plot(w_open, "Weekly Open", color=color.orange, linewidth=2, style=plot.style_linebr)

// ===== SIGNALS =====
plotshape(buySignal, "ENTRY", shape.labelup, location.belowbar, color=color.green, text="BUY 2QTY", textcolor=color.white)
plotshape(sellSignal, "ENTRY", shape.labeldown, location.abovebar, color=color.red, text="SELL 2QTY", textcolor=color.white)

// ===== DAY SEPARATOR =====
bgcolor(ta.change(time("D")) != 0 ? color.new(color.gray, 90) : na)