Price_Deviation Oleg
ลิงก์ TradingView
คำอธิบาย
📘 Description
This script is an extended and customized version of the original work by the respected author fullmax.
I adapted the logic for my own trading needs and added several improvements, including lot‑precision rounding to prevent exchange errors when using webhook automation, as well as additional visualization elements for clarity.
🔧 Key Enhancements
Lot precision control (prevents invalid quantity errors on exchanges when using webhooks)
Base order labels for easier visual tracking
Mini‑table with live position metrics
Configurable date‑range window for backtesting
Dynamic safety‑order price calculation
Trailing take‑profit option
Improved visualization of thresholds, MA, and TP levels
🎯 How the Strategy Works
The script calculates a moving average and compares the current price deviation against user‑defined thresholds.
When the deviation condition is met, the strategy opens a base position and then manages it using safety orders that scale in both volume and distance.
After entering a position, the script manages exits using:
a fixed take‑profit target
or an optional trailing take‑profit
plus a breakeven reference line
and an auto‑close mechanism when the averaging cycle resets
All order quantities are rounded according to the selected lot precision to ensure compatibility with exchange requirements when sending webhook‑based orders.
⚙️ Features Overview
Deviation‑based entry logic
Safety orders with volume and step scaling
Configurable date window for testing
Trailing TP with adjustable distance
Breakeven visualization
Mini‑table showing quantity, USD value, open trades, PnL, and equity
Clean and intuitive chart visualization
📝 Disclaimer
This script is provided for educational purposes only.
It does not constitute financial advice and does not guarantee profits.
Always test strategies on historical data before using them in live trading.
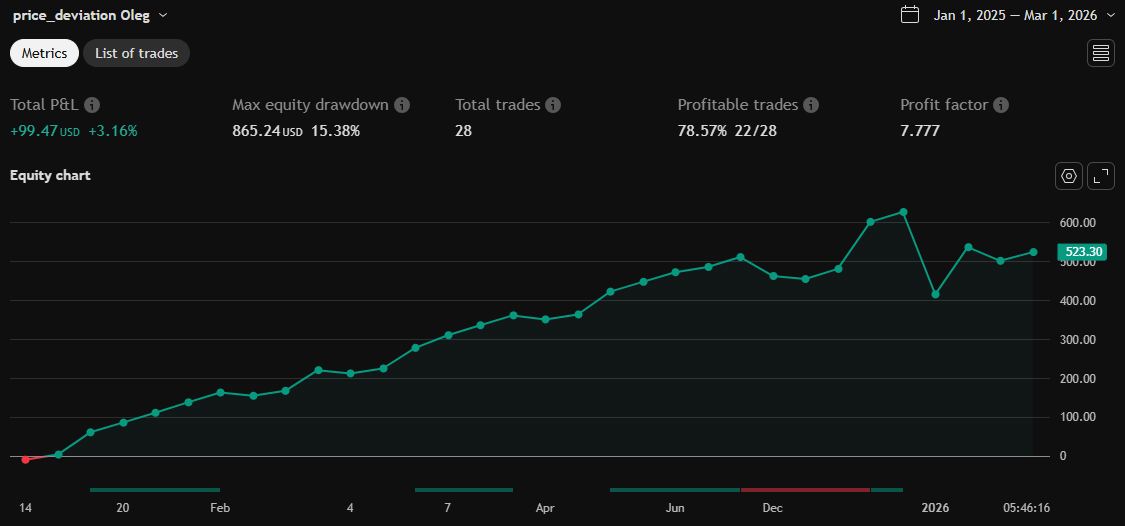
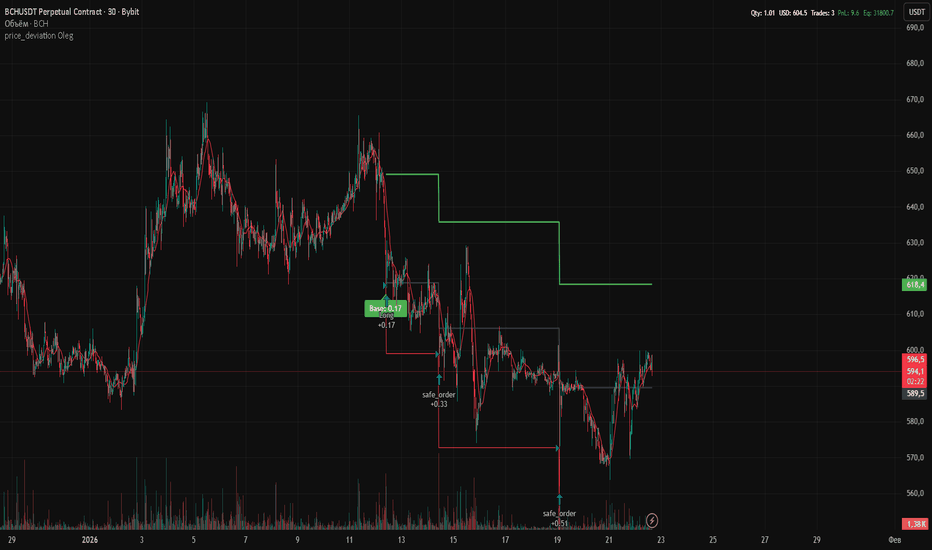
รูป Preview
Pine Script Source
//@version=6
strategy("price_deviation Oleg", overlay = true, initial_capital = 30000, pyramiding = 15)

// === Lot precision ===
lot_precision     = input.int(3, "Lot precision (decimal places)", minval = 0, maxval = 8)
show_base_labels  = input.bool(true, "Показывать метку базового ордера")
show_small_table  = input.bool(true, "Показывать мини-таблицу")

roundQty(q) =>
    factor = math.pow(10.0, lot_precision)
    raw    = math.ceil(q * factor) / factor
    math.max(1.0 / factor, raw)

// === Date Ranges ===
from_month = input.int(1, 'From Month', minval = 1, maxval = 12)
from_day   = input.int(1, 'From Day', minval = 1, maxval = 31)
from_year  = input(2021, 'From Year')
to_month   = input.int(1, 'To Month', minval = 1, maxval = 12)
to_day     = input.int(1, 'To Day', minval = 1, maxval = 31)
to_year    = input(9999, 'To Year')

start  = timestamp(from_year, from_month, from_day, 00, 00)
finish = timestamp(to_year, to_month, to_day, 23, 59)
window = time >= start and time <= finish

// === Strategy Inputs ===
price_deviation = input.float(3.1, 'Price deviation (%)', step = 0.1) / 100
take_profit     = input.float(2.5, 'Take Profit (%)', step = 0.01) / 100

base_order_raw = input.float(1000.0, 'start order')
safe_order_raw = input.float(500.0,  'safe order')

base_order = roundQty(base_order_raw / close)
safe_order = roundQty(safe_order_raw / close)

safe_order_volume_scale = input.float(1.49, step = 0.01)
safe_order_step_scale   = input.float(1.37, step = 0.01)
max_safe_order          = input.int(4, 'max safe order')

var float initial_order = 0.0

// === Threshold logic ===
lengthp = input.int(15, 'Length of sma - threshold')
trh     = input.float(3.1, step = 0.1, title = 'threshold first trade') * -1
trhL    = input.float(2.5, step = 0.1, title = 'threshold bull market') * -1

avg_price = ta.sma(close, lengthp)
price_diff = (close - avg_price) / avg_price * 100

NB   = input.int(3, 'Bars rising to switch bull')
bull = ta.rising(avg_price, NB)

buy_pricediff = not bull ? price_diff <= trh : price_diff <= trhL

// === First Position ===
if strategy.opentrades == 0 and window and buy_pricediff
    strategy.entry("Long", strategy.long, qty = base_order)
    initial_order := close

    if show_base_labels
        label.new(bar_index, low, "Base: " + str.tostring(base_order),
            style = label.style_label_up, color = color.green)

// === Safety Order Price ===
thresholdsaveorder = 0.0

if safe_order_step_scale == 1.0
    thresholdsaveorder := initial_order - initial_order * price_deviation * safe_order_step_scale * strategy.opentrades
else
    thresholdsaveorder := initial_order - initial_order *
         ((price_deviation * math.pow(safe_order_step_scale, strategy.opentrades) - price_deviation) /
         (safe_order_step_scale - 1))

// === Safety Orders ===
if strategy.opentrades > 0 and strategy.opentrades < max_safe_order
    so_qty = roundQty(safe_order * math.pow(safe_order_volume_scale, strategy.opentrades - 1))
    strategy.entry("safe_order", strategy.long, qty = so_qty, limit = thresholdsaveorder)

// === Take Profit ===
take_profit_level = strategy.position_avg_price * (1 + take_profit)

takeProfitTrailingEnabled = input.bool(false, "Enable Trailing", group = "Take Profit")
trailingTakeProfitDistancePerc = input.float(1.0, "Trailing Distance %", step = 0.01, group = "Take Profit") / 100

longTrailingTakeProfitStepTicks = take_profit_level * trailingTakeProfitDistancePerc / syminfo.mintick

if strategy.position_size > 0
    strategy.exit("ALL",
        limit        = takeProfitTrailingEnabled ? na : take_profit_level,
        trail_price  = takeProfitTrailingEnabled ? take_profit_level : na,
        trail_offset = takeProfitTrailingEnabled ? longTrailingTakeProfitStepTicks : na)

// === Plots ===
plot(take_profit_level, style = plot.style_linebr, linewidth = 2, color = color.green)
plot(thresholdsaveorder, color = strategy.position_size <= 0 ? na : color.red)
plot(avg_price, "Short MA", color = color.new(color.red, 0))

// === Breakeven ===
fee = input.float(0.1, "exchange fee") / 100
be  = strategy.position_avg_price * (1 + fee)
plot(be, style = plot.style_linebr, linewidth = 2, color = color.black)

// === Auto close ===
if ta.crossunder(strategy.opentrades, 0.5)
    strategy.close_all()
    strategy.cancel_all()

// === MINI TABLE ===
if show_small_table
    sum_qty     = strategy.position_size
    sum_usd     = sum_qty * close
    open_trades = strategy.opentrades
    open_pnl    = strategy.openprofit
    eq          = strategy.equity

    var table mini = table.new(position.top_right, 5, 1, bgcolor = na)

    table.cell(mini, 0, 0, "Qty: "    + str.tostring(sum_qty),                  text_color = color.white, bgcolor = na, text_size = size.small)
    table.cell(mini, 1, 0, "USD: "    + str.tostring(sum_usd,  format.mintick), text_color = color.white, bgcolor = na, text_size = size.small)
    table.cell(mini, 2, 0, "Trades: " + str.tostring(open_trades),              text_color = color.white, bgcolor = na, text_size = size.small)
    table.cell(mini, 3, 0, "PnL: "    + str.tostring(open_pnl, format.mintick), text_color = open_pnl >= 0 ? color.green : color.red, bgcolor = na, text_size = size.small)
    table.cell(mini, 4, 0, "Eq: "     + str.tostring(eq,       format.mintick), text_color = eq >= 0 ? color.green : color.red,      bgcolor = na, text_size = size.small)