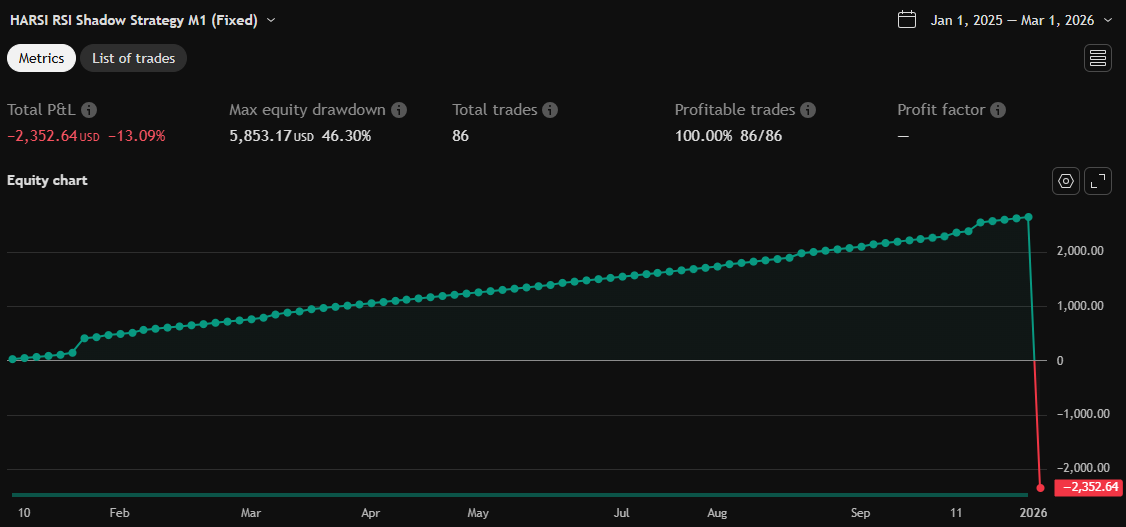
mua HARSI RSI Shadow Strategy M1 (Fixed)
ลิงก์ TradingView
คำอธิบาย
HARSI – Heikin Ashi RSI Shadow Indicator
HARSI (Heikin Ashi RSI Shadow) is a momentum-based oscillator that combines the concept of Heikin Ashi smoothing with the Relative Strength Index (RSI) to reduce market noise and highlight short-term trend strength.
Instead of plotting traditional price candles, HARSI transforms RSI values into a zero-centered oscillator (RSI − 50), allowing traders to clearly identify bullish and bearish momentum around the median line. The smoothing mechanism inspired by Heikin Ashi candles helps filter out false signals, making the indicator especially effective on lower timeframes such as M1.
The RSI Shadow reacts quickly to momentum shifts while maintaining smooth transitions, which makes it suitable for scalping and intraday trading. Key threshold levels (such as ±20 and ±30) can be used to detect momentum expansion, exhaustion, and potential continuation setups.
HARSI works best in liquid markets and can be used as a standalone momentum indicator or combined with trend filters such as moving averages or VWAP for higher-probability trades.
Key Features:
Zero-centered RSI oscillator (RSI − 50)
Heikin Ashi–style smoothing to reduce noise
Clear momentum-based entry signals
Optimized for lower timeframes (M1 scalping)
Suitable for both Spot and Futures trading
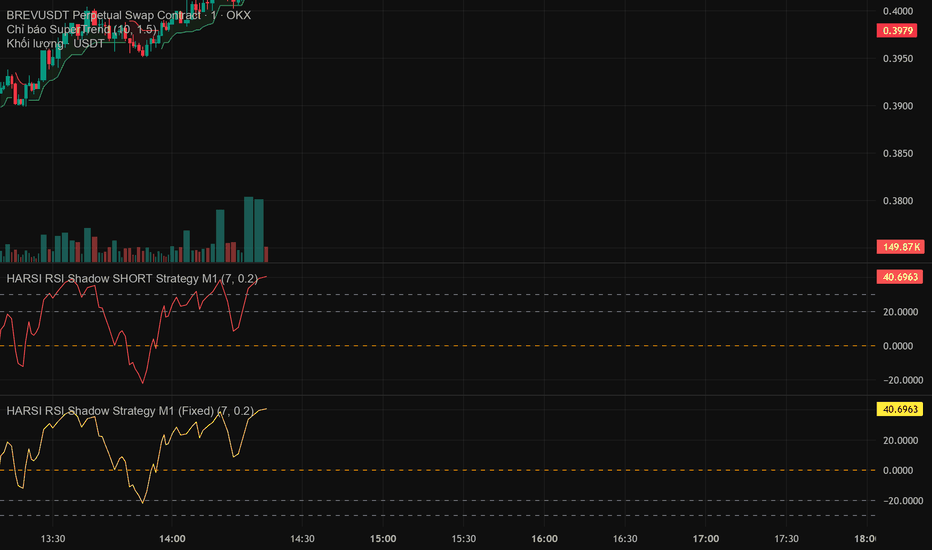
รูป Preview
Pine Script Source
//@version=5
strategy("HARSI RSI Shadow Strategy M1 (Fixed)",
     overlay = false,
     pyramiding = 0,
     default_qty_type = strategy.percent_of_equity,
     default_qty_value = 100,
     initial_capital = 10000,
     calc_on_every_tick = true)

// ===== INPUT =====
rsiLen = input.int(7, "RSI Length")
tpPerc = input.float(0.2, "Take Profit (%)", step = 0.01) / 100

// ===== RSI SHADOW (HARSI STYLE) =====
rsi_shadow = ta.rsi(ohlc4, rsiLen) - 50

// ===== STATE MEMORY =====
var bool crossedMinus30 = false

// RSI cắt lên -30 → ghi nhớ
if ta.crossover(rsi_shadow, -30)
    crossedMinus30 := true

// RSI cắt lên -20 và trước đó đã cắt -30
buySignal = crossedMinus30 and ta.crossover(rsi_shadow, -20)

// ===== ENTRY =====
if buySignal
    strategy.entry("BUY", strategy.long)
    crossedMinus30 := false   // reset tránh spam lệnh

// ===== TAKE PROFIT 0.2% =====
if strategy.position_size > 0
    tpPrice = strategy.position_avg_price * (1 + tpPerc)
    strategy.exit("TP", "BUY", limit = tpPrice)

// ===== VISUAL =====
hline(0, "Zero", color=color.orange)
hline(-20, "-20", color=color.gray)
hline(-30, "-30", color=color.gray)
plot(rsi_shadow, title="RSI Shadow", color=color.yellow)