Ichimoku Cloud Strategy - 1H Hyperliquid
ลิงก์ TradingView

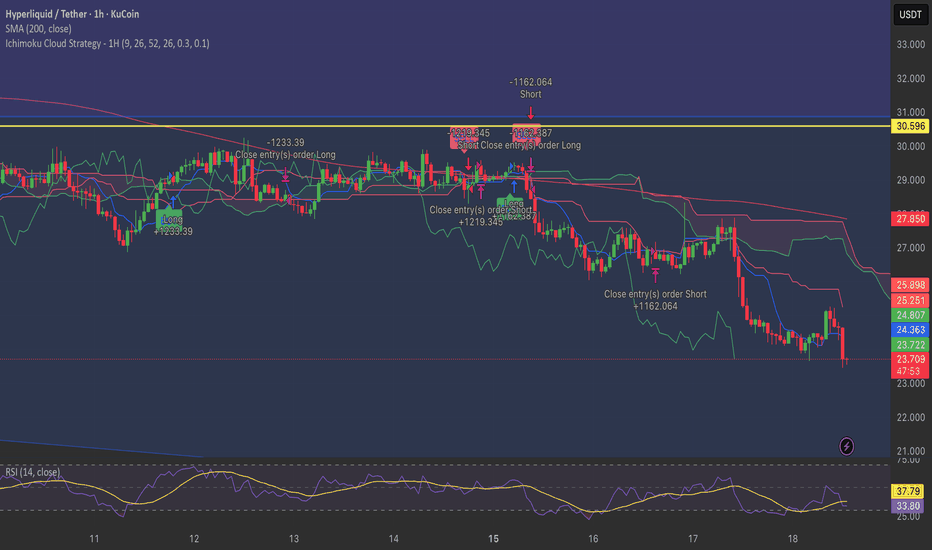
คำอธิบาย
Stategy for Hyperliquid 1hr time frame using Ichimoku's Cloud.
รูป Preview
Pine Script Source
//@version=5
strategy("Ichimoku Cloud Strategy - 1H", overlay=true, initial_capital=10000, default_qty_type=strategy.percent_of_equity, default_qty_value=100)

// Ichimoku Cloud Settings - Standard Parameters for 1H
conversionPeriods = input.int(9, minval=1, title="Conversion Line Length")
basePeriods = input.int(26, minval=1, title="Base Line Length")
laggingSpan2Periods = input.int(52, minval=1, title="Leading Span B Length")
displacement = input.int(26, minval=1, title="Lagging Span Displacement")

// Cloud Thickness Filter
cloudThicknessPercent = input.float(0.3, minval=0, title="Minimum Cloud Thickness %", tooltip="Minimum distance between cloud spans as % of price")

// Stop Loss Settings
useStopLoss = input.bool(true, title="Use Stop Loss")
stopLossPercent = input.float(0.1, minval=0.1, maxval=20, title="Stop Loss %", tooltip="Stop loss percentage from entry price")

// Calculate Ichimoku Components
donchian(len) => math.avg(ta.lowest(len), ta.highest(len))

conversionLine = donchian(conversionPeriods)
baseLine = donchian(basePeriods)
leadLine1 = math.avg(conversionLine, baseLine)
leadLine2 = donchian(laggingSpan2Periods)

// Plot Ichimoku Cloud
p1 = plot(conversionLine, color=color.new(color.blue, 0), title="Conversion Line")
p2 = plot(baseLine, color=color.new(color.red, 0), title="Base Line")
p3 = plot(close, offset=-displacement, color=color.new(color.green, 0), title="Lagging Span")

p4 = plot(leadLine1, offset=displacement, color=color.new(color.green, 0), title="Leading Span A")
p5 = plot(leadLine2, offset=displacement, color=color.new(color.red, 0), title="Leading Span B")

fill(p4, p5, color=leadLine1 > leadLine2 ? color.new(color.green, 90) : color.new(color.red, 90), title="Cloud")

// Trading Signals
// Compare price to the displaced cloud (where it actually appears on chart)
priceAboveCloud = close > math.max(leadLine1[displacement], leadLine2[displacement])
priceBelowCloud = close < math.min(leadLine1[displacement], leadLine2[displacement])
conversionCrossOver = ta.crossover(conversionLine, baseLine)
conversionCrossUnder = ta.crossunder(conversionLine, baseLine)

// Cloud Thickness Filter - check current cloud thickness
cloudSpanA = leadLine1
cloudSpanB = leadLine2
cloudThickness = math.abs(cloudSpanA - cloudSpanB)
cloudThicknessRatio = (cloudThickness / close) * 100
isCloudThickEnough = cloudThicknessRatio >= cloudThicknessPercent

// Track if we have an open position
var bool hasBuySignal = false

// Entry Conditions - with cloud thickness filter
longCondition = conversionCrossOver and priceAboveCloud and not hasBuySignal and isCloudThickEnough
shortCondition = conversionCrossUnder and priceBelowCloud and hasBuySignal and isCloudThickEnough

// Update buy signal state
if longCondition
    hasBuySignal := true
if shortCondition
    hasBuySignal := false

// Exit Conditions
exitLong = conversionCrossUnder or priceBelowCloud
exitShort = conversionCrossOver or priceAboveCloud

// Execute Trades
if longCondition
    strategy.entry("Long", strategy.long)

if exitLong
    strategy.close("Long")

if shortCondition
    strategy.entry("Short", strategy.short)

if exitShort
    strategy.close("Short")

// Plot Buy/Sell Signals
plotshape(longCondition, title="Buy Signal", location=location.belowbar, color=color.new(color.green, 0), style=shape.labelup, text="BUY", size=size.small)
plotshape(shortCondition, title="Sell Signal", location=location.abovebar, color=color.new(color.red, 0), style=shape.labeldown, text="SELL", size=size.small)