Dragon Indicator by Matej
ลิงก์ TradingView

คำอธิบาย
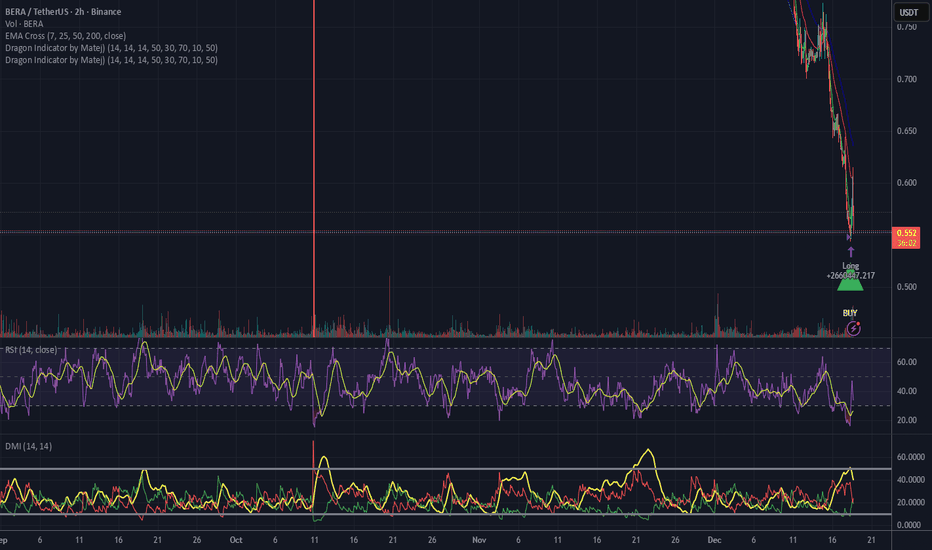
Indicator prints buy and sell signals and prints exit trade suggestion.
รูป Preview
Pine Script Source
//@version=5
strategy("Dragon Indicator by Matej)", overlay=true, default_qty_type=strategy.percent_of_equity, default_qty_value=100)

// === Inputs ===
adxLength = input.int(14, "ADX Length", group="Indicator Settings")
diLength  = input.int(14, "DI Length", group="Indicator Settings")
rsiLength = input.int(14, "RSI Length", group="Indicator Settings")

adxThreshold = input.int(50, "ADX > Threshold", group="Signal Conditions")
rsiLower    = input.int(30, "RSI Oversold < Threshold", group="Signal Conditions")
rsiUpper    = input.int(70, "RSI Overbought > Threshold", group="Signal Conditions")
diThreshold = input.int(10, "DI+ or DI- < Threshold", group="Signal Conditions")

// Exit when RSI crosses midline (customize if needed)
exitRsiLevel = input.int(50, "Exit RSI Midline Level", group="Exit Settings")

// === Calculations ===
[diPlus, diMinus, adxValue] = ta.dmi(diLength, adxLength)
rsiValue = ta.rsi(close, rsiLength)

// Plot indicators in separate pane
plot(adxValue, "ADX", color=color.orange, display=display.pane)
plot(rsiValue, "RSI", color=color.purple, display=display.pane)
plot(diPlus, "DI+", color=color.green, display=display.pane)
plot(diMinus, "DI-", color=color.red, display=display.pane)

// === Signal Conditions ===
adxStrong = adxValue > adxThreshold
weakDI    = (diPlus < diThreshold) or (diMinus < diThreshold)

potentialBuy  = adxStrong and (rsiValue < rsiLower) and weakDI
potentialSell = adxStrong and (rsiValue > rsiUpper) and weakDI

// === One Active Signal Only Logic ===
// Track if we are in an active trade
var bool inTrade = false

// Exit conditions (RSI crossing midline in trade direction)
buyExit  = inTrade and strategy.position_size > 0 and ta.crossover(rsiValue, exitRsiLevel)
sellExit = inTrade and strategy.position_size < 0 and ta.crossunder(rsiValue, exitRsiLevel)

// Actual signals only when NOT in a trade
buySignal  = potentialBuy and not inTrade
sellSignal = potentialSell and not inTrade

// Update inTrade state
if (buySignal or sellSignal)
    inTrade := true
if (buyExit or sellExit)
    inTrade := false

// === Plot Signals on Main Chart ===
plotshape(buySignal, title="Buy Signal", location=location.belowbar,
          color=color.green, style=shape.triangleup, size=size.large,
          text="BUY", textcolor=color.white)

plotshape(sellSignal, title="Sell Signal", location=location.abovebar,
          color=color.red, style=shape.triangledown, size=size.large,
          text="SELL", textcolor=color.white)

// === Strategy Execution ===
if (buySignal)
    strategy.entry("Long", strategy.long)

if (sellSignal)
    strategy.entry("Short", strategy.short)

// Exit on RSI midline cross
if (buyExit)
    strategy.close("Long")

if (sellExit)
    strategy.close("Short")