Crypto LONG PY
ลิงก์ TradingView
คำอธิบาย
This trading approach is a powerful combination of technical tools aimed at taking advantage of market fluctuations with precision and reliability. By integrating Bollinger Bands (BB), the Relative Strength Index (RSI), Exponential Moving Averages (EMA), and Fibonacci retracement levels (Fib), we create a strategy that captures key market moves and helps identify optimal entry and exit points, all within the context of the New York market conditions (NY).
Bollinger Bands provide insight into market volatility, offering signals about potential extreme price movements. The RSI is used to measure momentum and assess overbought or oversold conditions, indicating when the market might be nearing a reversal. Meanwhile, EMAs add a layer of smoothing, allowing us to observe short- and medium-term trends, helping filter out false signals and providing a clearer view of the overall market direction.
Additionally, Fibonacci retracements are integrated to identify key support and resistance levels, pinpointing potential areas of price retracement and continuation. When combined, these indicators offer a holistic approach to navigating the markets, enabling traders to make data-driven, informed decisions.
This approach is ideal for traders looking for a meticulous methodology for trading during the NY session, where liquidity and volatility tend to be at their highest. Leverage the synergy between these indicators to optimize your trading strategy and maximize your market performance.
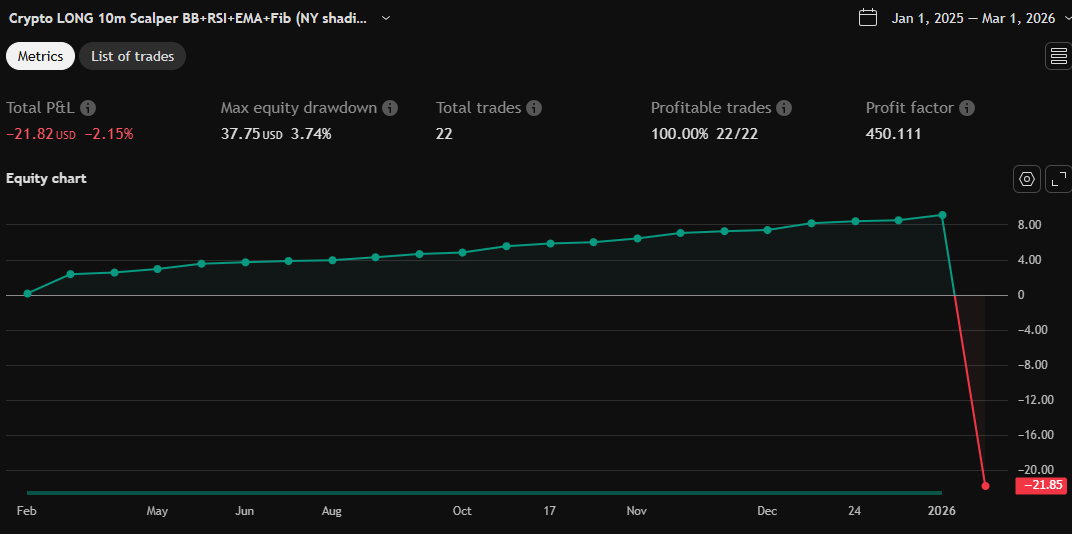
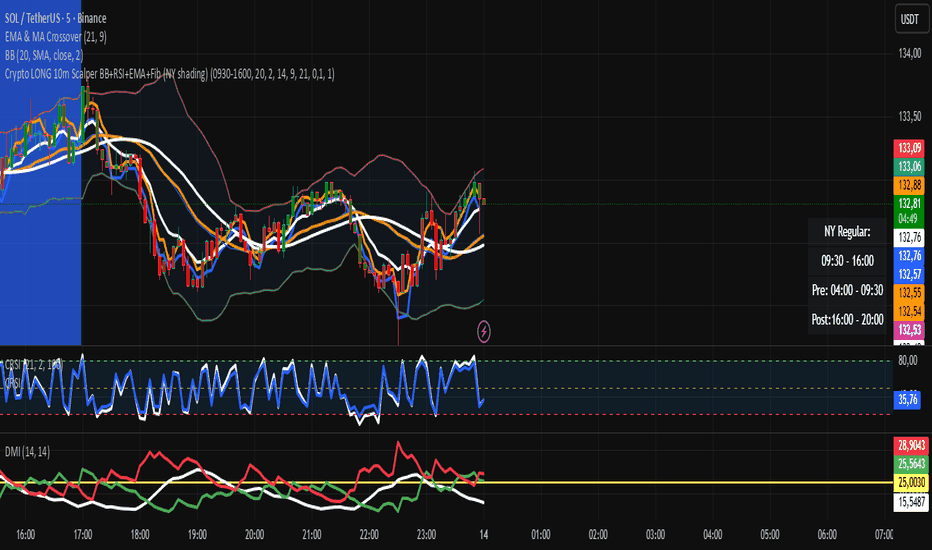
รูป Preview
Pine Script Source
// This Pine Script® code is subject to the terms of the Mozilla Public License 2.0 at https://mozilla.org/MPL/2.0/
// © Saletrader1

//@version=6
strategy(
     "Crypto LONG 10m Scalper BB+RSI+EMA+Fib (NY shading)",
     overlay           = true,
     initial_capital   = 100,
     default_qty_type  = strategy.percent_of_equity,
     default_qty_value = 30,
     pyramiding        = 1,
     commission_type   = strategy.commission.percent,
     commission_value  = 0.06)


// Solo LONG
strategy.risk.allow_entry_in(strategy.direction.long)

//---------------------------------------------------------
// 1) Sesión New York (visual, no filtro por defecto)
//---------------------------------------------------------
sessionNY   = input.session("0930-1600", "Horario sesión NY (ej. 09:30-16:00)")
inSessionNY = not na(time(timeframe.period, sessionNY))
useNyFilter = input.bool(false, "Operar solo en horario NY?")

dayNum    = dayofmonth(time)
isEvenDay = (dayNum % 2) == 0
sessColor = isEvenDay ? color.new(color.purple, 50) : color.new(color.blue, 30)
bgcolor(inSessionNY ? sessColor : na)

// Tabla con horarios NY
var table nyTable = table.new(position.bottom_right, 1, 4, border_width = 1)
if barstate.islast
    table.cell(nyTable, 0, 0, "NY Regular:",         text_color = color.white, bgcolor = color.new(color.black, 80))
    table.cell(nyTable, 0, 1, "09:30 - 16:00",       text_color = color.white, bgcolor = color.new(color.black, 80))
    table.cell(nyTable, 0, 2, "Pre: 04:00 - 09:30",  text_color = color.white, bgcolor = color.new(color.black, 80))
    table.cell(nyTable, 0, 3, "Post:16:00 - 20:00",  text_color = color.white, bgcolor = color.new(color.black, 80))

sessionOK = useNyFilter ? inSessionNY : true

//---------------------------------------------------------
// 2) Parámetros
//---------------------------------------------------------
bbLength   = input.int(20,    "Bollinger Length")
bbMult     = input.float(2.0, "Bollinger Mult", step = 0.1)
rsiLength  = input.int(14,    "RSI Length")
emaLength  = input.int(9,     "EMA 9 Length")
smaLength  = input.int(21,    "SMA 21 Length")

// Beneficio mínimo > 0 para permitir cerrar
minProfitPct  = input.float(0.1, "Beneficio mínimo para cerrar (%)", minval = 0.0, maxval = 20.0)
minProfitFrac = minProfitPct / 100.0

// Umbral cruce inminente EMA9 vs SMA21 (para salida técnica)
deltaPctIn  = input.float(1.0, "Delta cruce inminente EMA9~SMA21 (%)", minval = -1.0, maxval = 3.0)
deltaThresh = deltaPctIn / 100.0

// Tiempo máximo en operación: 10 minutos
holdMinutes   = 10
holdMs        = holdMinutes * 60 * 1000

//---------------------------------------------------------
// 3) Indicadores básicos
//---------------------------------------------------------
[basis, bbUpper, bbLower] = ta.bb(close, bbLength, bbMult)
rsi   = ta.rsi(close, rsiLength)
ema9  = ta.ema(close, emaLength)
sma21 = ta.sma(close, smaLength)

delta = sma21 != 0.0 ? (ema9 - sma21) / sma21 : 0.0

//---------------------------------------------------------
// 4) Fibonacci en ventana de 10 minutos
//---------------------------------------------------------
// Convertimos 10 minutos a número de velas según el timeframe actual
tfSec      = timeframe.in_seconds(timeframe.period)
barsFibRaw = 600.0 / tfSec
barsFib    = math.max(3, int(math.round(barsFibRaw)))  // mínimo 3 barras

swingHigh  = ta.highest(high, barsFib)
swingLow   = ta.lowest(low,  barsFib)
validSwing = swingHigh > swingLow

fib38 = validSwing ? (swingLow + (swingHigh - swingLow) * 0.382) : na
fib62 = validSwing ? (swingLow + (swingHigh - swingLow) * 0.618) : na

// Dibujamos como soportes/resistencias
plot(fib38, title = "Fib 38.2%", color = color.new(color.teal, 0), linewidth = 1, style = plot.style_linebr)
plot(fib62, title = "Fib 61.8%", color = color.new(color.orange, 0), linewidth = 1, style = plot.style_linebr)

// Zona dorada
fibLow  = na(fib38) or na(fib62) ? na : (fib38 < fib62 ? fib38 : fib62)
fibHigh = na(fib38) or na(fib62) ? na : (fib38 > fib62 ? fib38 : fib62)
inFibZone = validSwing and not na(fibLow) and not na(fibHigh) and close >= fibLow and close <= fibHigh

//---------------------------------------------------------
// 5) Lógica de compra
//---------------------------------------------------------
// Tendencia bajista: precio bajo la SMA21 y SMA21 descendiendo
trendDown = close < sma21 and sma21 < sma21[1]

// EMA 9 girando al alza
emaTurnUp = ema9 > ema9[1] and ema9[1] < ema9[2]

// Compra en tendencia no bajista (setup original BB+RSI+EMA+Fib)
buyUptrend =
     not trendDown and
     close < bbLower and
     rsi < 20 and
     emaTurnUp and
     inFibZone

// Valle en tendencia bajista: valle en low[1] + EMA9 sube ahora
valleyDown =
     trendDown and
     inFibZone and
     ema9 > ema9[1] and
     low[1] < low[2] and
     low[1] < low

buyDowntrend = valleyDown

// Condición final de entrada
canEnter = strategy.position_size == 0 and sessionOK
enterLong = canEnter and (buyUptrend or buyDowntrend)

//---------------------------------------------------------
// 6) Lógica de venta
//---------------------------------------------------------
// Señal técnica (BB sup + RSI alto + cruce inminente EMA/SMA)
sellSignal =
     strategy.position_size > 0 and
     close > bbUpper and
     rsi > 81 and
     ema9 > sma21 and
     delta <= deltaThresh

avgPrice = strategy.position_avg_price
haveProfit = avgPrice > 0 and close >= avgPrice * (1.0 + minProfitFrac)

// Control de tiempo en operación (10 minutos)
var int entryTime = na
if enterLong
    entryTime := time

inPosition = strategy.position_size > 0 and not na(entryTime)
timeLimitReached = inPosition and (time - entryTime >= holdMs)

// Salidas:
// 1) Señal técnica + ganancia
exitBySignal = sessionOK and sellSignal and haveProfit
// 2) Fin de los 10 minutos + ganancia (aunque no haya señal)
exitByTime   = sessionOK and timeLimitReached and haveProfit

exitLong = exitBySignal or exitByTime

if enterLong
    strategy.entry("LONG", strategy.long)

if exitLong
    strategy.close("LONG")
    entryTime := na

//---------------------------------------------------------
// 7) Etiquetas BUY/SELL con PnL
//---------------------------------------------------------
var label lastBuyLabel  = na
var label lastSellLabel = na

if enterLong
    if not na(lastBuyLabel)
        label.delete(lastBuyLabel)
    lastBuyLabel := label.new(
         bar_index,
         low,
         "BUY\n" + str.tostring(close, format.mintick),
         style     = label.style_label_up,
         color     = color.new(color.green, 0),
         textcolor = color.white,
         size      = size.tiny
     )

if exitLong
    pnlPerc = avgPrice != 0.0 ? (close - avgPrice) / avgPrice * 100.0 : na
    if not na(lastSellLabel)
        label.delete(lastSellLabel)
    lastSellLabel := label.new(
         bar_index,
         high,
         "SELL\n" +
         str.tostring(close, format.mintick) +
         "\nP&L: " + str.tostring(pnlPerc, "#.##") + "%",
         style     = label.style_label_down,
         color     = color.new(color.red, 0),
         textcolor = color.white,
         size      = size.tiny
     )

//---------------------------------------------------------
// 8) Plots de referencia
//---------------------------------------------------------
plot(bbUpper, "BB Upper", color = color.new(color.blue, 40))
plot(basis,   "BB Basis", color = color.new(color.orange, 60))
plot(bbLower, "BB Lower", color = color.new(color.blue, 40))

plot(ema9,  "EMA 9",  color = color.new(color.yellow, 0))
plot(sma21, "SMA 21", color = color.new(color.fuchsia, 0))

plotshape(enterLong, title = "Señal LONG", style = shape.triangleup,
          location = location.belowbar, color = color.lime, size = size.tiny, text = "L")

plotshape(exitLong, title = "Señal SELL", style = shape.triangledown,
          location = location.abovebar, color = color.red, size = size.tiny, text = "S")