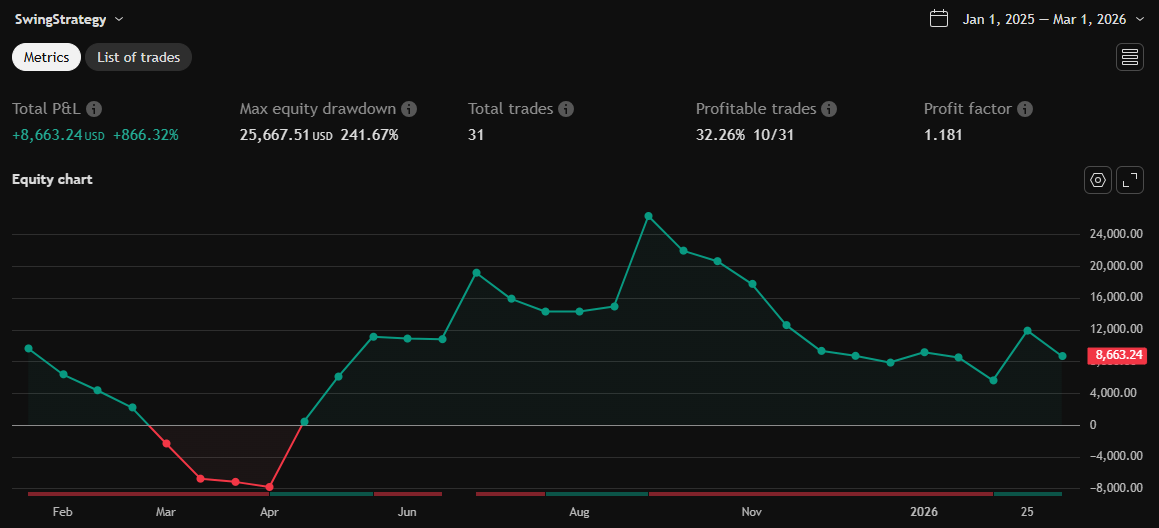
Swing Trading Strategy
ลิงก์ TradingView
คำอธิบาย
Alejandro Cardona: messing around with this code for 2 years. Investment start 2500$ profit 0.87% 1 trade and dip
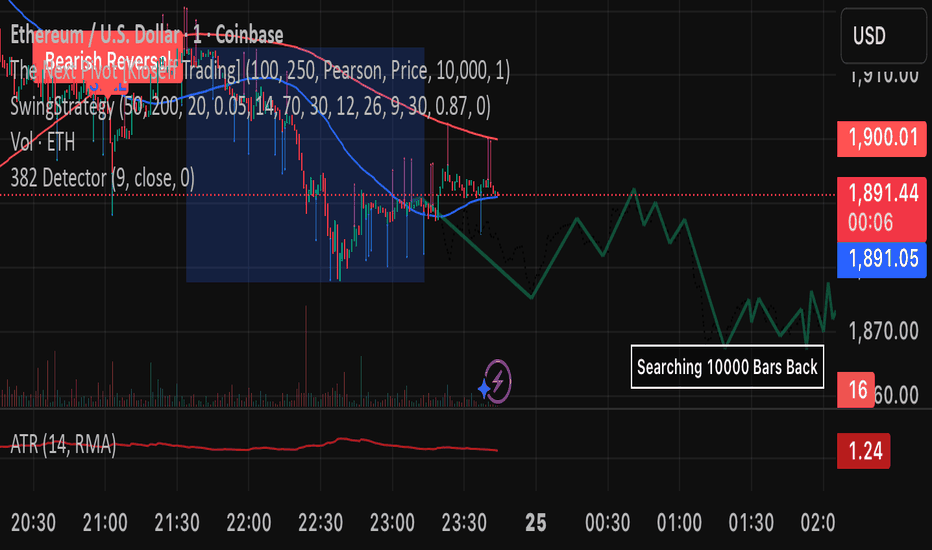
รูป Preview
Pine Script Source
//@version=5
strategy("Swing Trading Strategy", shorttitle="SwingStrategy", overlay=true)

// Input parameters with default settings that work well for swing trading
short_window = input.int(50, title="Short SMA Window")  // Adjusted to 50 periods
long_window = input.int(200, title="Long SMA Window")  // Adjusted to 200 periods
lookback = input.int(20, title="Pullback Lookback Period")
pullback_threshold = input.float(0.05, title="Pullback Threshold")
rsi_length = input.int(14, title="RSI Length")
rsi_overbought = input.int(70, title="RSI Overbought Level")
rsi_oversold = input.int(30, title="RSI Oversold Level")
macd_fast_length = input.int(12, title="MACD Fast Length")
macd_slow_length = input.int(26, title="MACD Slow Length")
macd_signal_length = input.int(9, title="MACD Signal Length")
stop_loss_percent = input.float(5.0, title="Stop Loss %")  // Adjusted to 5%
take_profit_percent = input.float(10.0, title="Take Profit %")  // Adjusted to 10%
min_holding_period = input.int(1, title="Minimum Holding Period (Days)")  // Minimum holding period in days

// Calculate SMAs
short_sma = ta.sma(close, short_window)
long_sma = ta.sma(close, long_window)

// Calculate RSI
rsi = ta.rsi(close, rsi_length)

// Calculate MACD
[macd_line, signal_line, _] = ta.macd(close, macd_fast_length, macd_slow_length, macd_signal_length)

// Detect reversals using SMA crossovers
bullish_reversal = ta.crossover(short_sma, long_sma)
bearish_reversal = ta.crossunder(short_sma, long_sma)

// Calculate rolling max and min for pullbacks
rolling_max = ta.highest(close, lookback)
rolling_min = ta.lowest(close, lookback)

// Detect pullbacks in an uptrend
pullback_in_uptrend = (close < rolling_max * (1 - pullback_threshold)) and (close[1] >= rolling_max[1] * (1 - pullback_threshold))

// Entry conditions
buy_condition = (bullish_reversal or (rsi < rsi_oversold and ta.crossover(macd_line, signal_line)))
sell_condition = (bearish_reversal or (rsi > rsi_overbought and ta.crossunder(macd_line, signal_line)))

// Execute trades with minimum holding period
if (buy_condition)
    strategy.entry("Long", strategy.long)

var float entry_price = na
var int entry_time = na

if (strategy.opentrades > 0)
    entry_price := strategy.opentrades.entry_price(0)
    entry_time := strategy.opentrades.entry_time(0)

if (strategy.opentrades > 0 and (time - entry_time) > min_holding_period * 24 * 60 * 60 * 1000)
    if (sell_condition)
        strategy.close("Long")

// Risk management with minimum holding period
if (strategy.opentrades > 0 and (time - entry_time) > min_holding_period * 24 * 60 * 60 * 1000)
    strategy.exit("Take Profit", "Long", limit=entry_price * (1 + take_profit_percent / 100))
    strategy.exit("Stop Loss", "Long", stop=entry_price * (1 - stop_loss_percent / 100))

// Plotting for the main chart
plot(short_sma, title="Short SMA", color=color.blue)
plot(long_sma, title="Long SMA", color=color.red)

// Plot signals
plotshape(series=bullish_reversal, title="Bullish Reversal", location=location.belowbar, color=color.green, style=shape.labelup, text="BUY")
plotshape(series=bearish_reversal, title="Bearish Reversal", location=location.abovebar, color=color.red, style=shape.labeldown, text="SELL")
plotshape(series=pullback_in_uptrend, title="Pullback in Uptrend", location=location.belowbar, color=color.blue, style=shape.circle, text="PULLBACK")

// Text annotations for reversals
var label bullish_label = na
var label bearish_label = na

if bullish_reversal
    label.delete(bullish_label)
    bullish_label := label.new(x=bar_index, y=low, text="Bullish Reversal", style=label.style_label_up, color=color.green, textcolor=color.white)

if bearish_reversal
    label.delete(bearish_label)
    bearish_label := label.new(x=bar_index, y=high, text="Bearish Reversal", style=label.style_label_down, color=color.red, textcolor=color.white)

// Plot RSI in a new pane
rsi_ind = request.security(syminfo.tickerid, "D", ta.rsi(close, rsi_length))
hline(70, "Overbought", color=color.red)
hline(30, "Oversold", color=color.green)
plot(rsi_ind, title="RSI", color=color.purple, linewidth=2)

// Plot MACD in the main chart
plot(macd_line, title="MACD Line", color=color.orange)
plot(signal_line, title="Signal Line", color=color.blue)